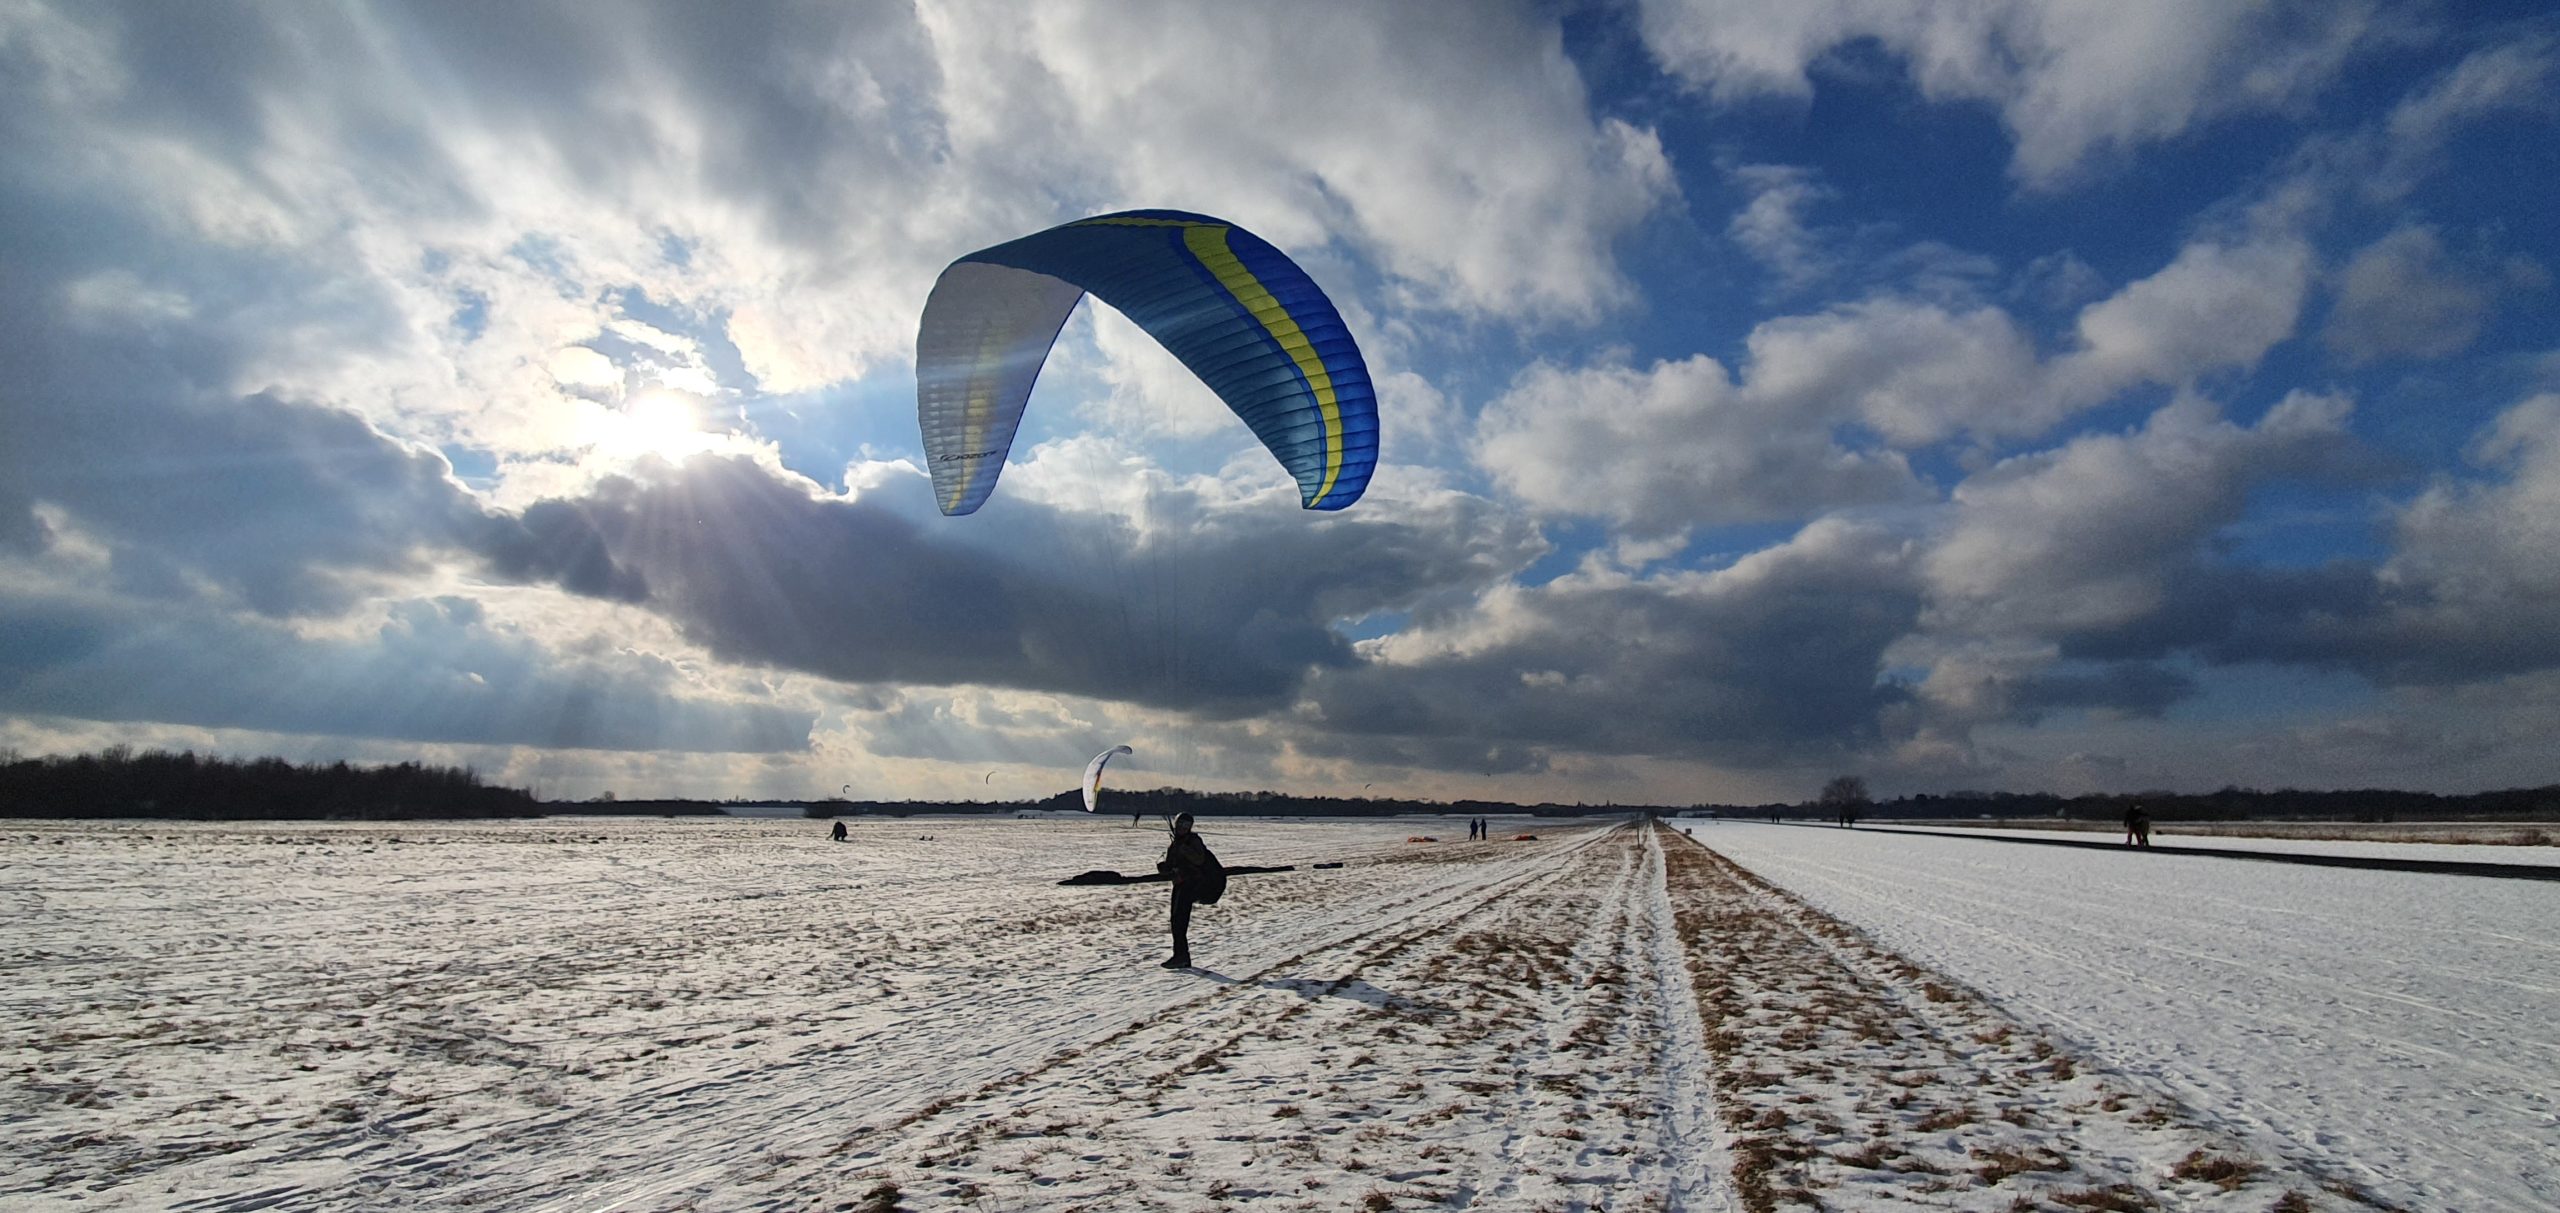
This post is a followup to the last one about Paragliding data gems.
We have collected lots of flights and their GPS location data. From this, several million thermals were extracted and shown on a heatmap. A step forward is to classify these thermals into meaningful groups. Some parameters are easy to extract. For example:
- Time of the day
- The month of the year
- The year
- Change in altitude
- Vertical velocity
I have shown in the previous post how the time of the day affects where a thermal is located. The other parameters are also nice to play around with.
One very interesting parameter would be the wind situation. As every pilot knows, the wind plays a crucial role in where turbulences occur and good conditions can be expected.
Finding the wind in our data
The wind consists of two values: Windspeed and direction. And because both values are surprisingly different depending on the height, the wind could be calculated several times. For the sake of simplicity, I am only calculating one wind speed and direction per thermal for now. This could be improved in a later version, when we know there is enough data to fine-grain the selection even more.
How can we calculate wind speed and direction without having access to wind stations and only based on the GPS track? It is not an easy task because the aircraft can turn in any direction and slow down/speed up. Let’s have a look at how a typical thermal with wind looks like:
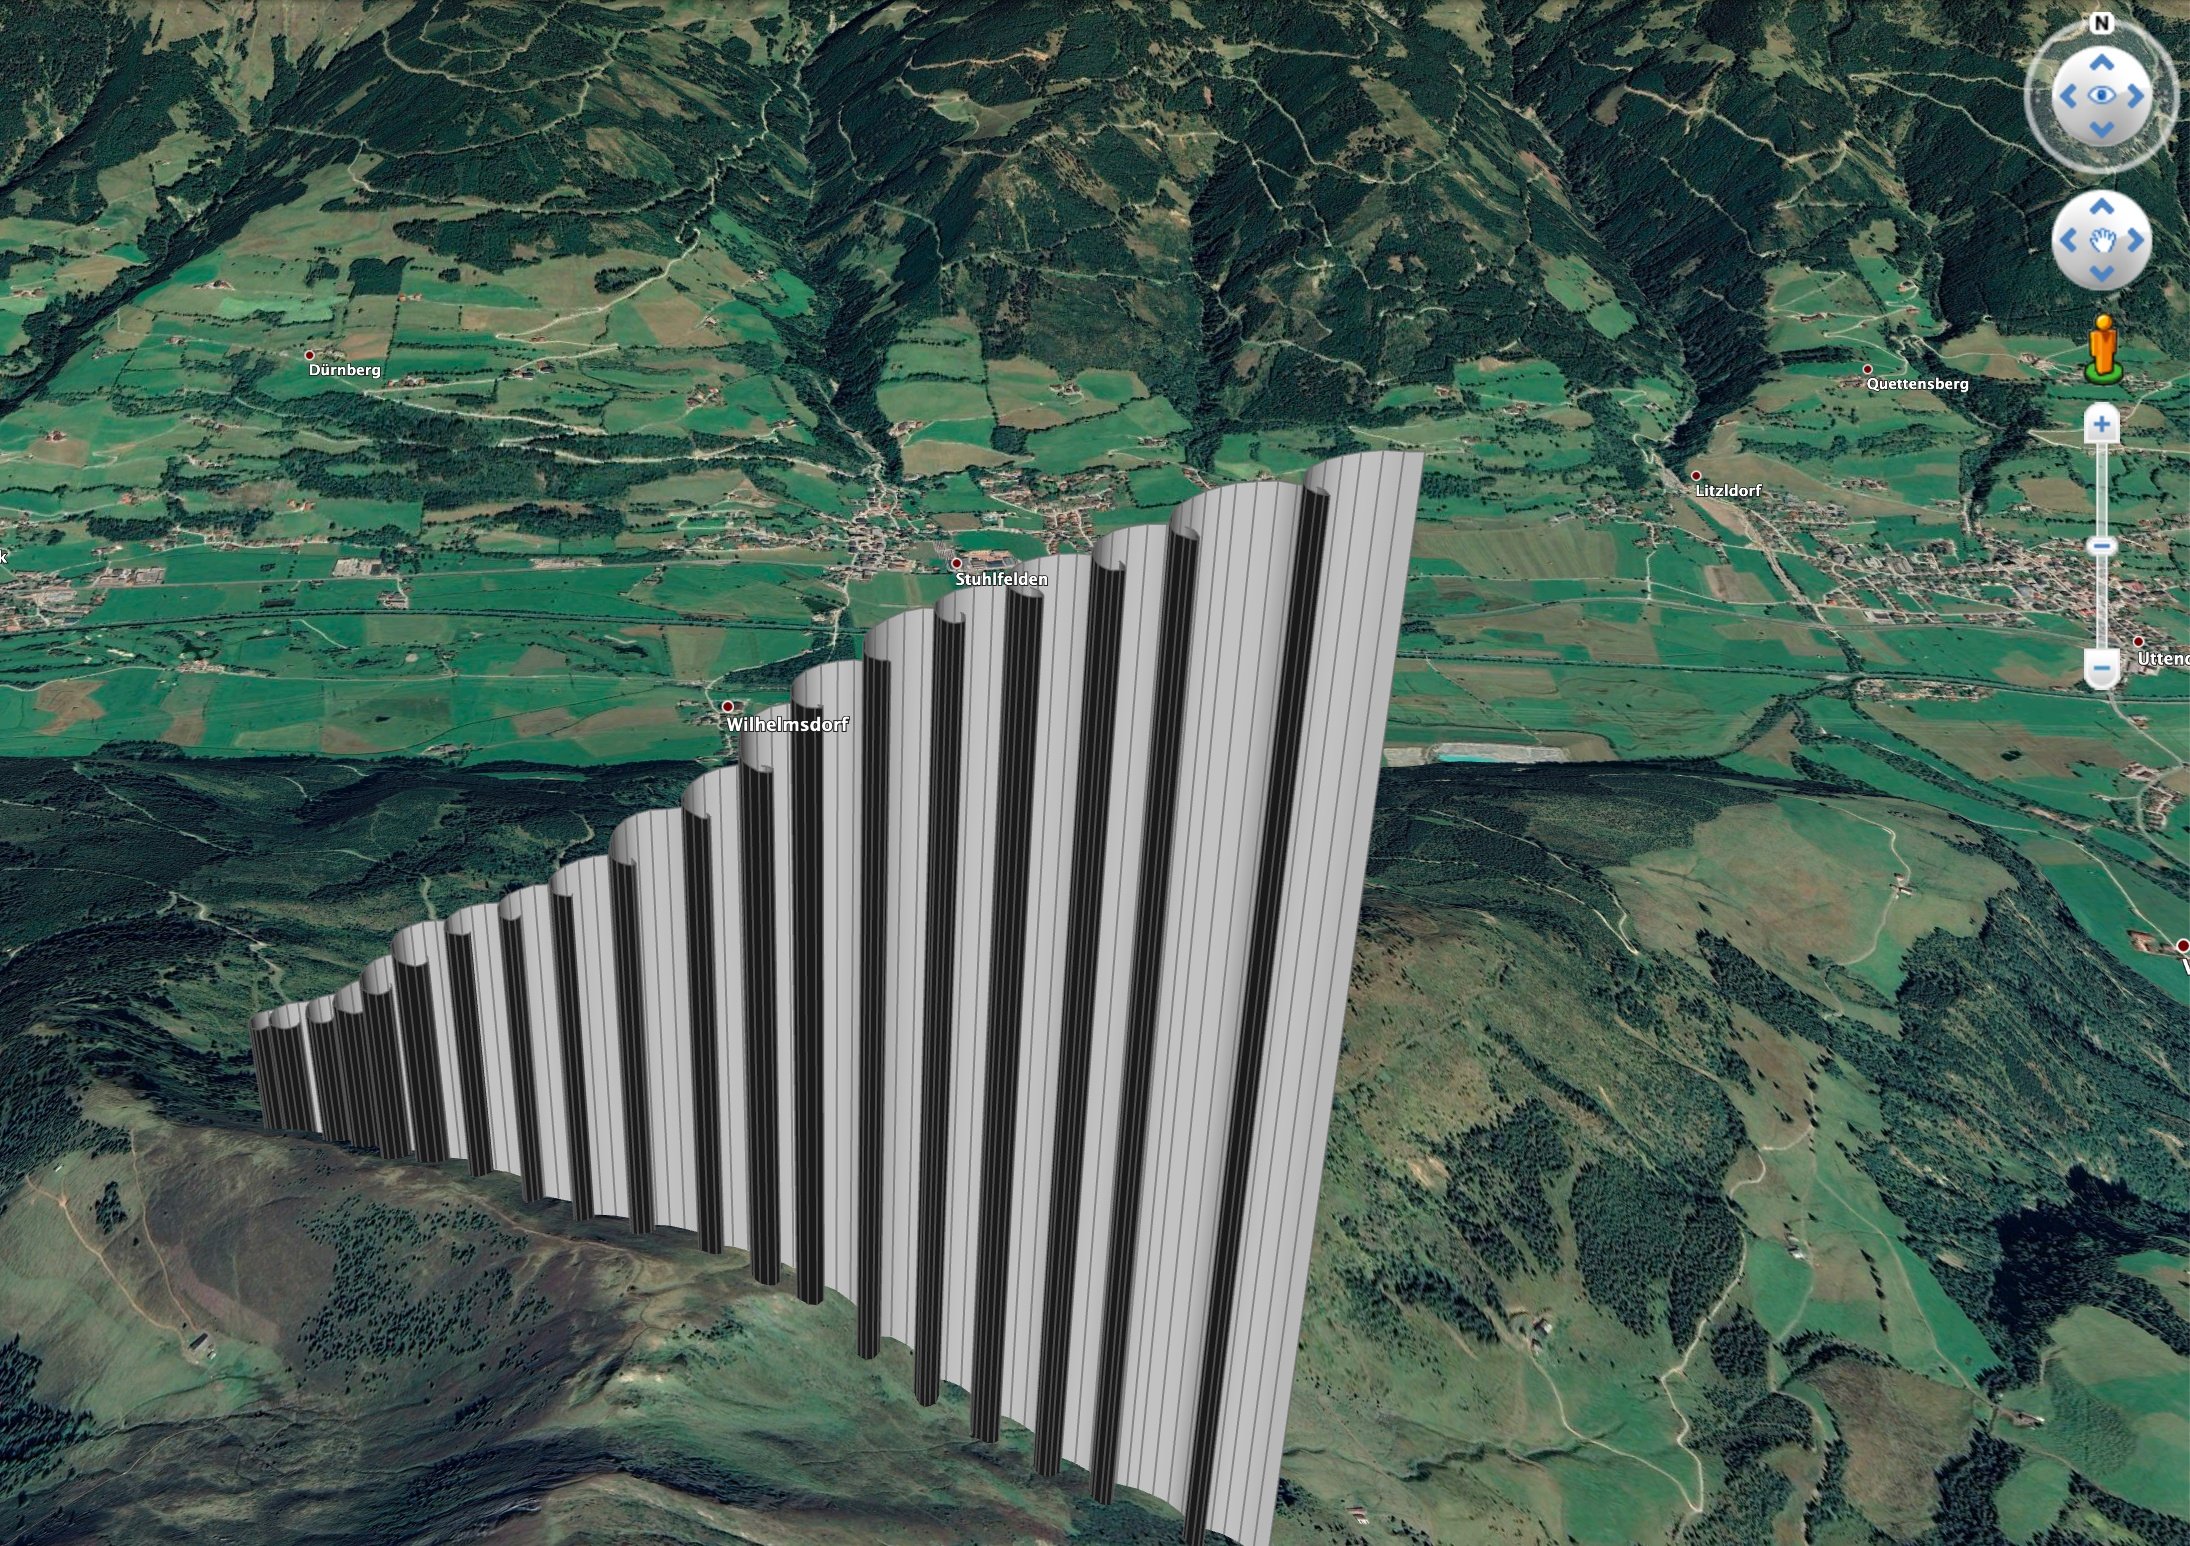
You can see part of a flight track starting on the lower left and ending on the upper right. There was significant lift and also significant wind drift to the (south-)east. In this case, simply comparing start and end would provide a good estimation of the wind speed and direction.
However, we can not be sure that the pilot follows the wind. Many other scenarios are possible, for example pushing towards the wind while being into several smaller thermal areas. Have a look at this thermal:

Was this change in location triggered by wind drift or by the pilot’s recentering into the core? We can not know by comparing the entry location with the exit location. But we can compute the speed values and direction for each two GPS points. Plotting speed and bearing for another thermal with strong west-wind gives the following:
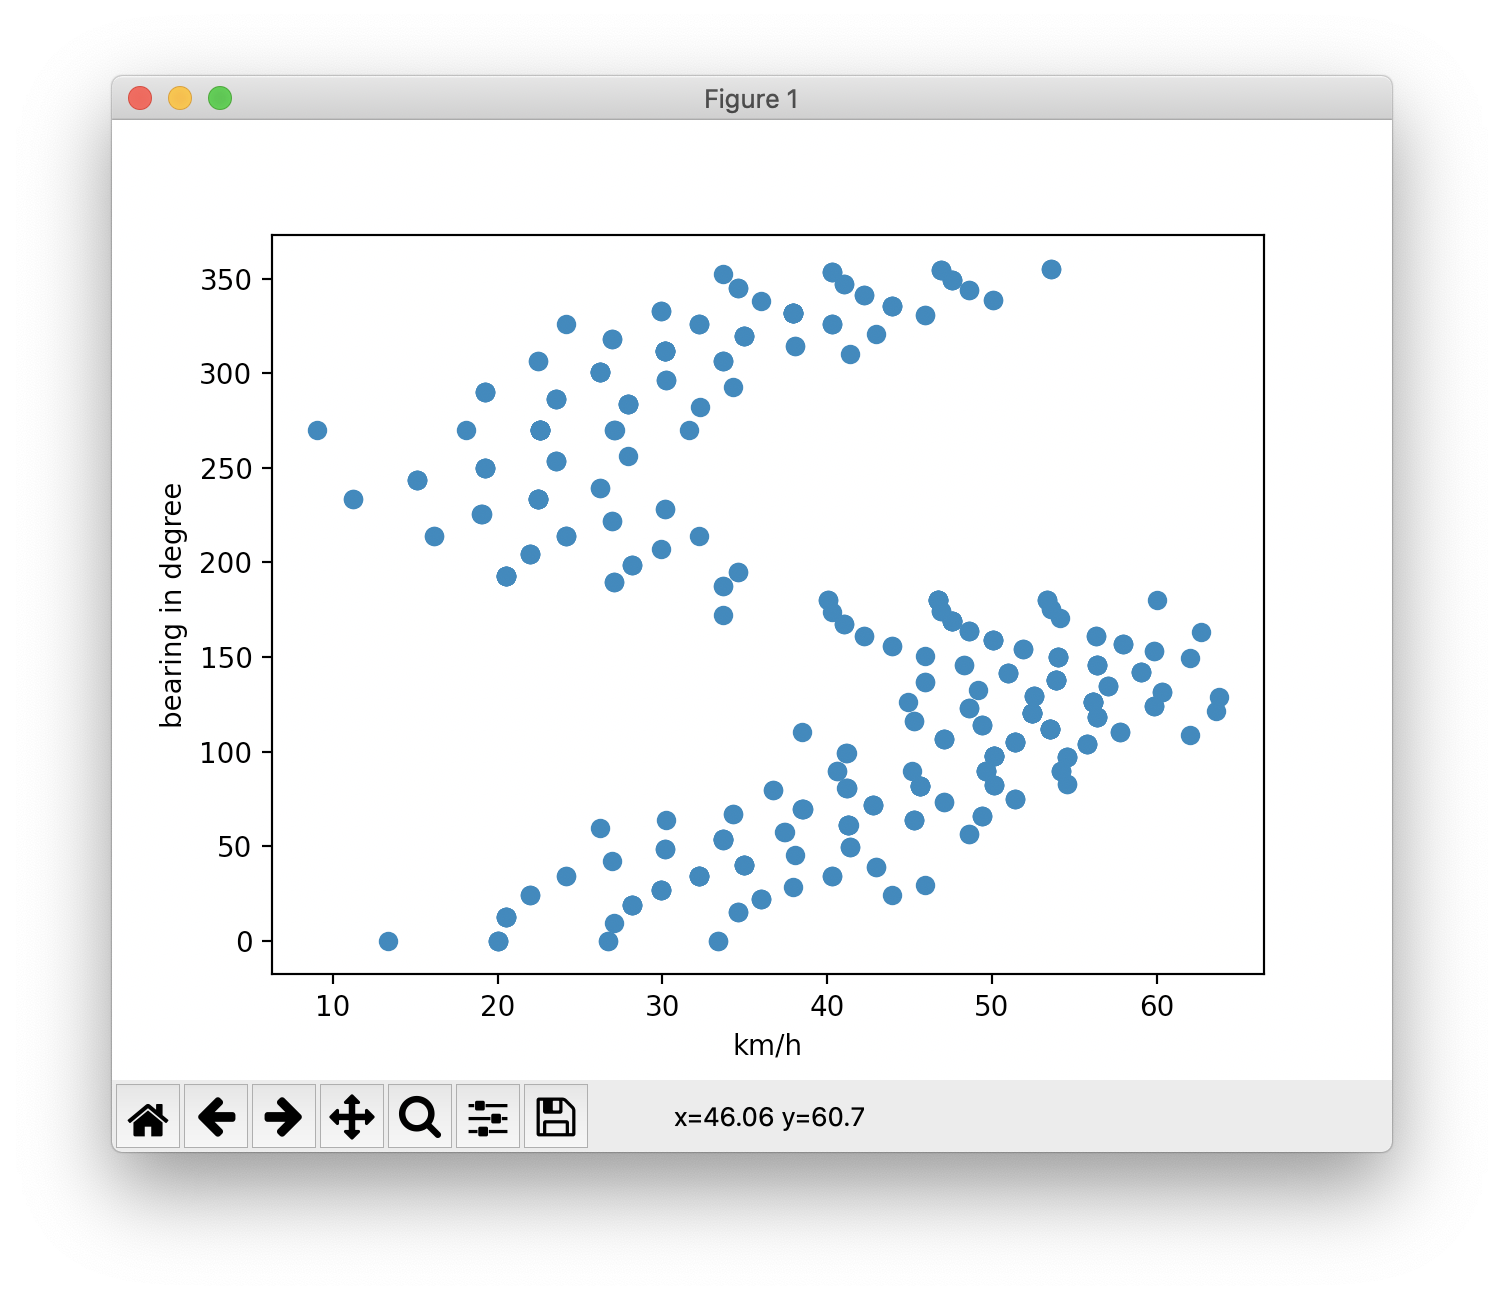
Here you see speed differences between ~20 km/h and ~60 km/h based on the bearing. The highest speed is ~120° and the lowest ~270°. If a pilot would steer against the wind for a longer time, these values wouldn’t change. We would merely see more points close to the existing ones in a certain area.
The plot above can be improved visually by using polar coordinates:
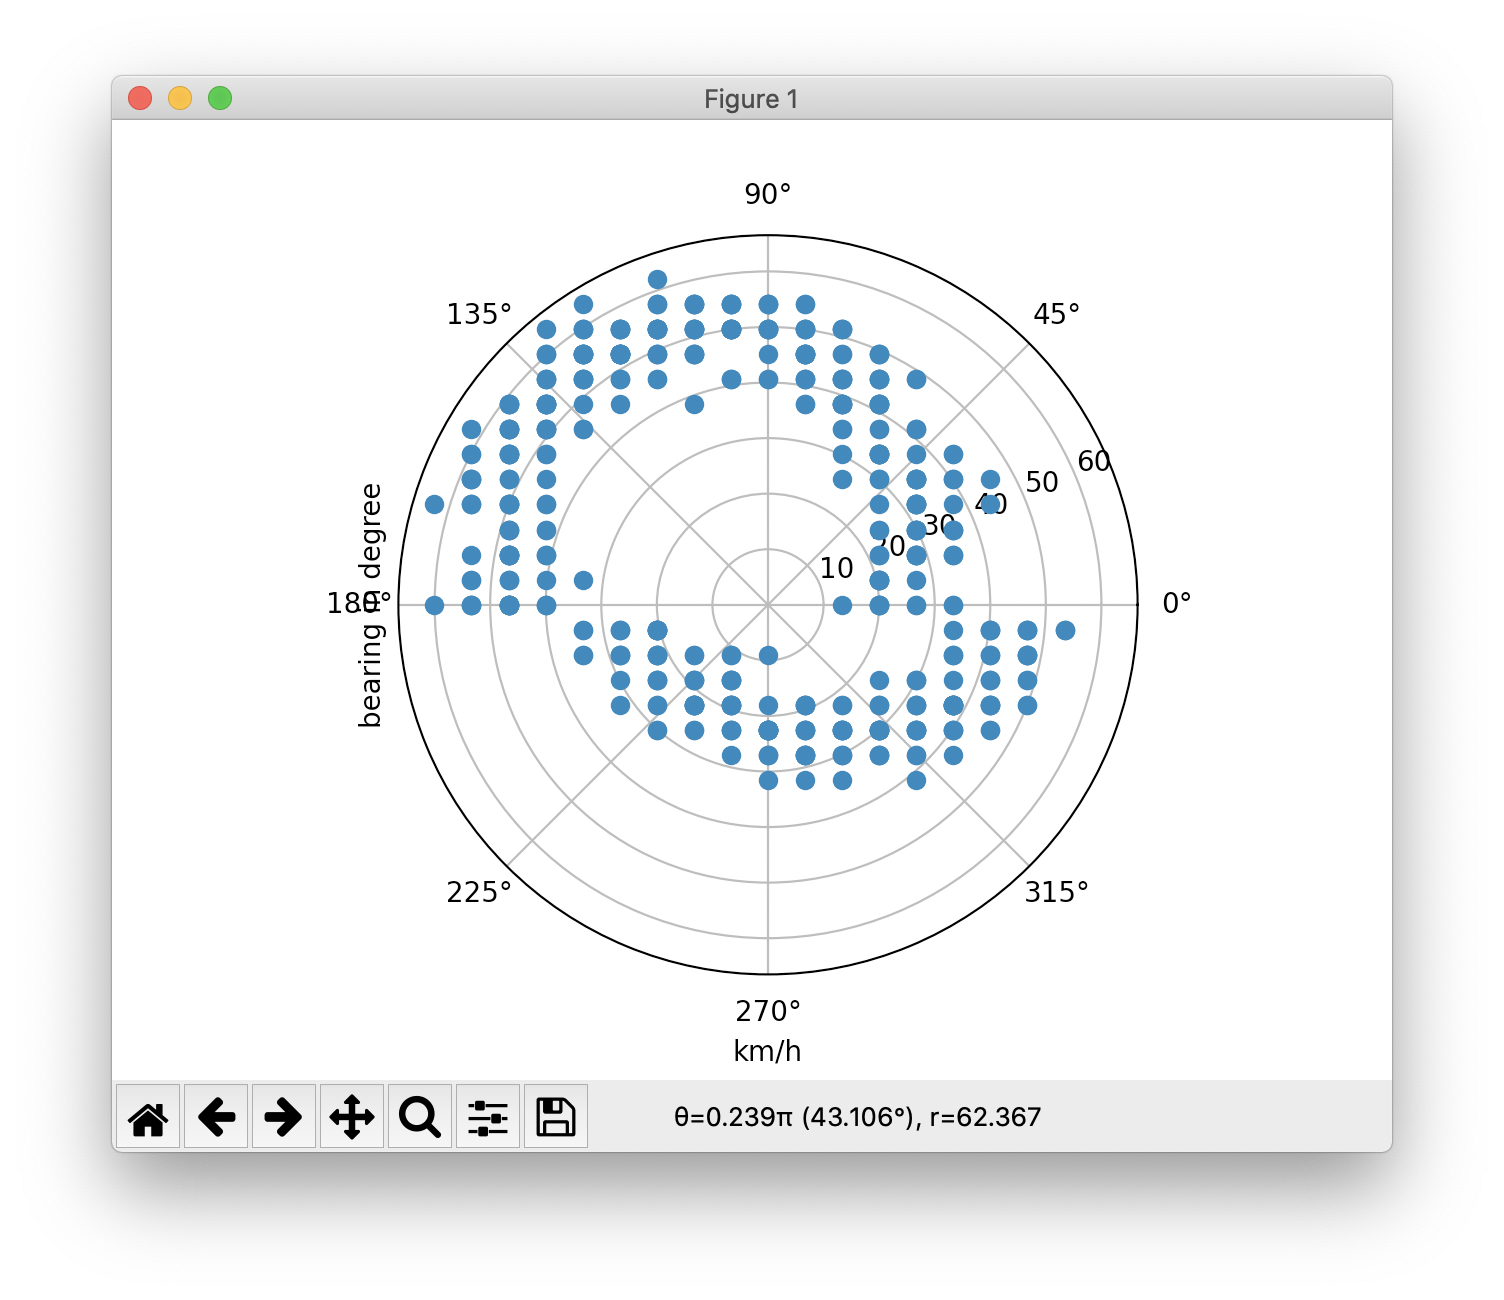
Here we have the bearing values mapped around a circle and the distance from the middle is the ground speed. If there was no wind at all, this should be a circle around the middle. In this case above, we can estimate a circle and the center gives us wind speed and direction, while the radius of the best fitting circle would be the aircraft airspeed.
The circle can be approximated with some scientific help of Dr. Koch and the mind-blowing scipy.optimize.leastsq function.
Map it on the heatmap
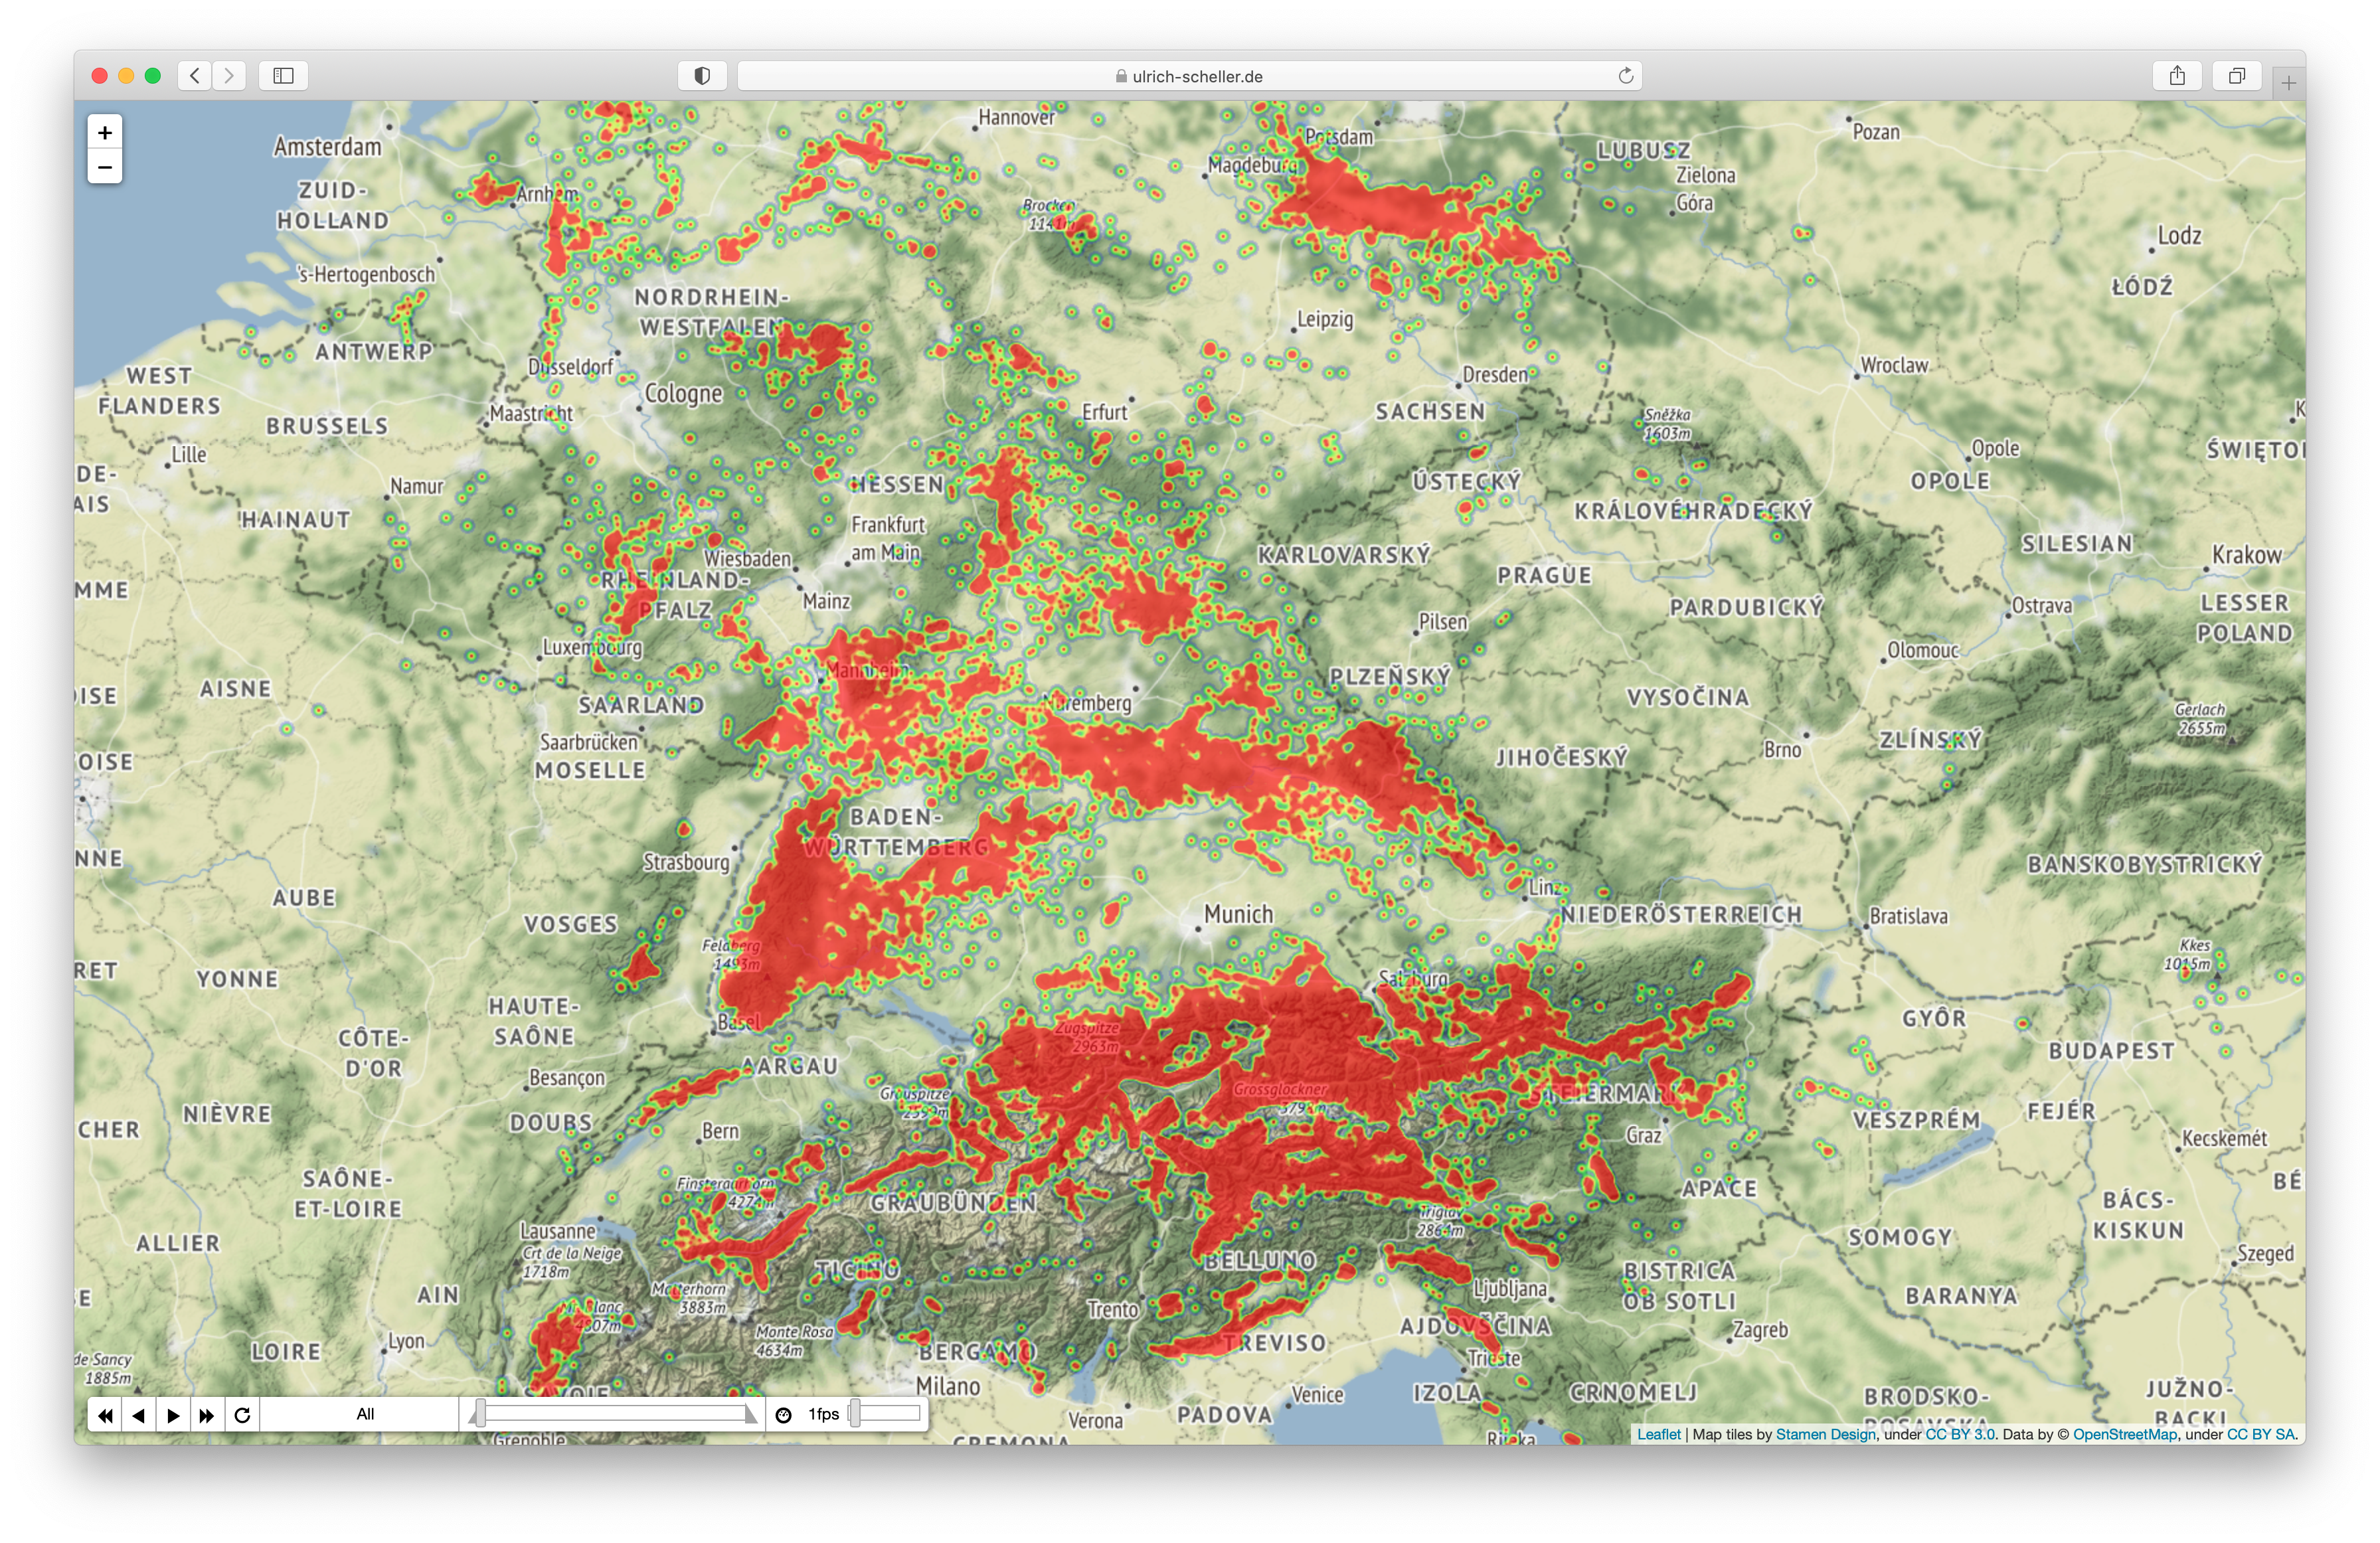
So let’s calculate this for lots of thermals and see how they are affected by which wind:
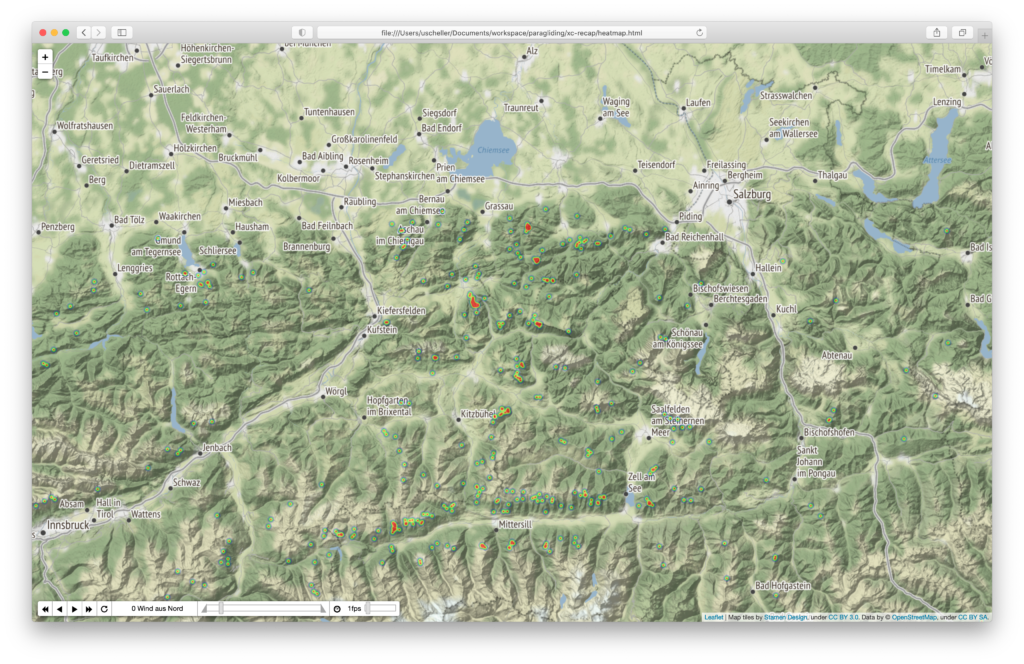
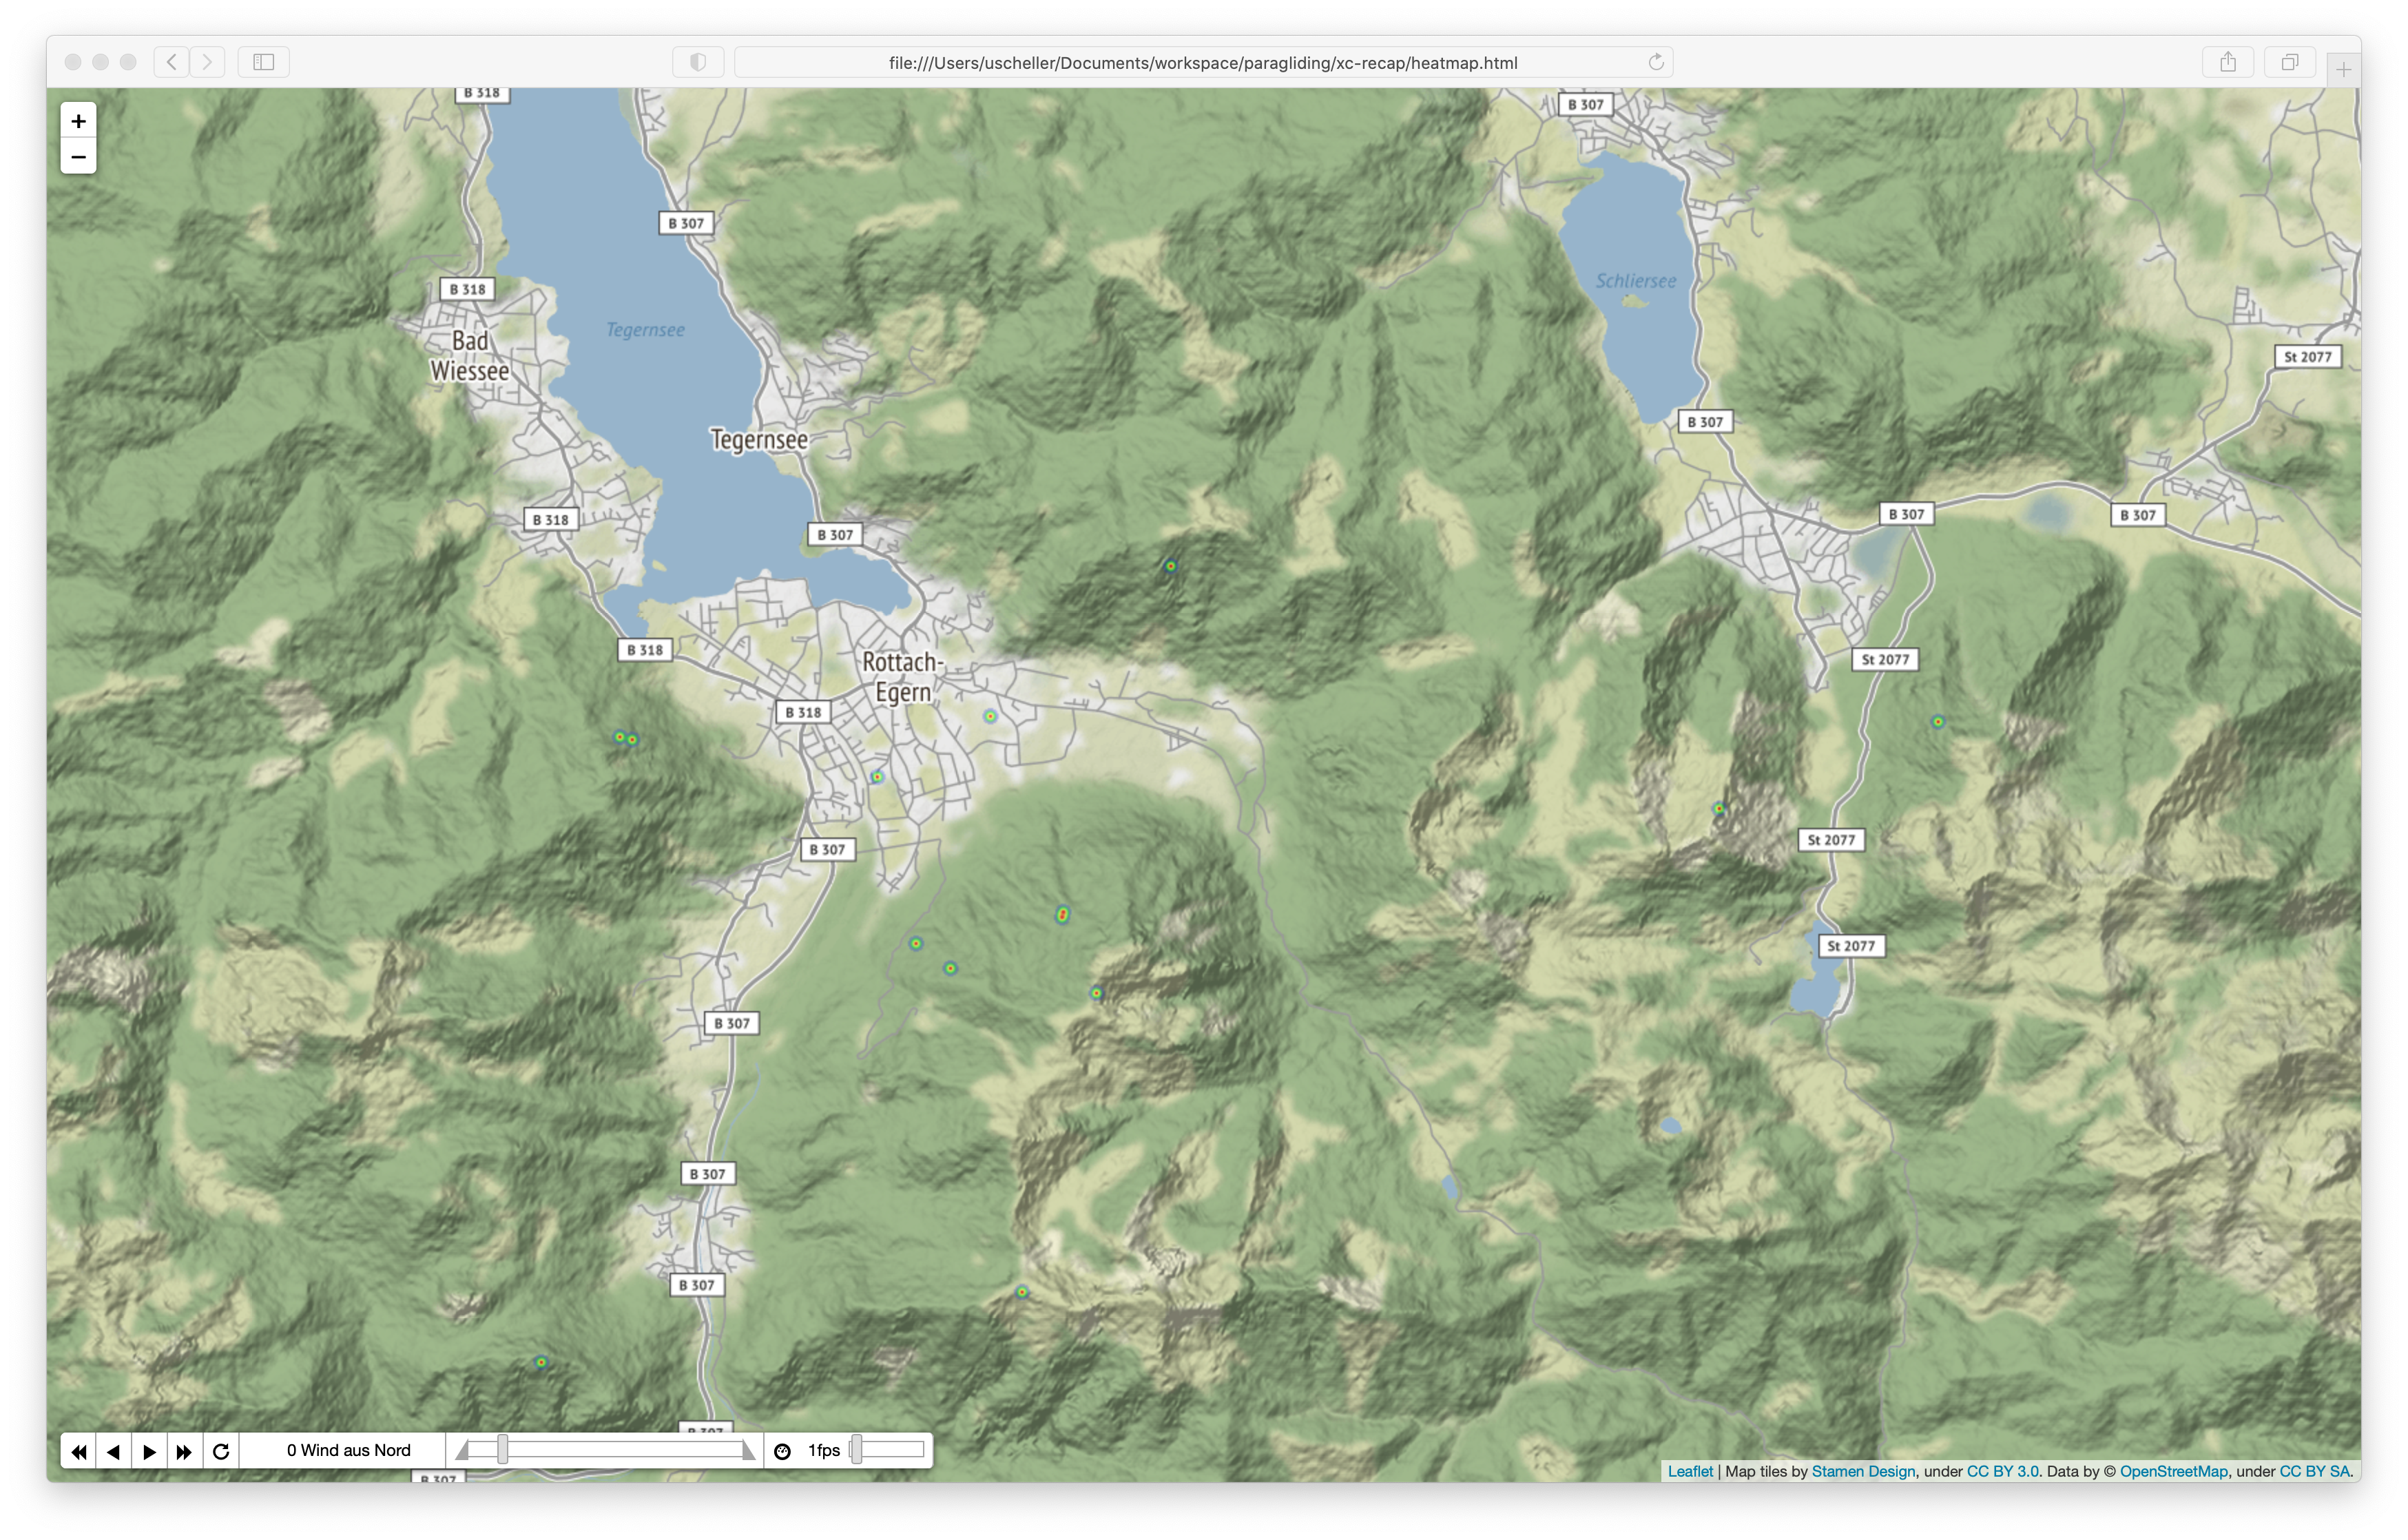
North 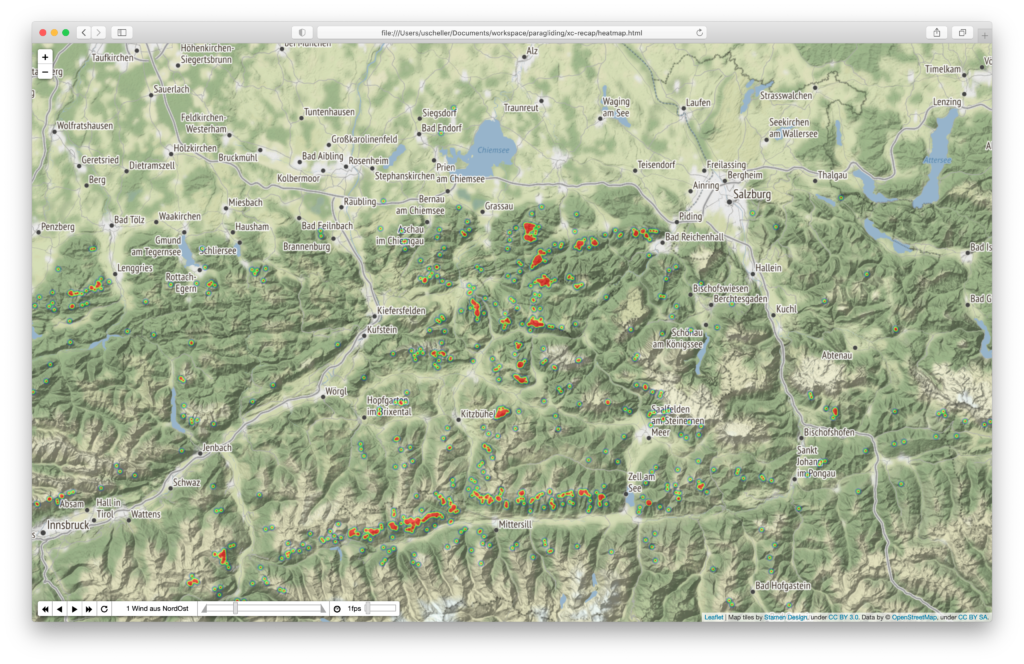
Northeast 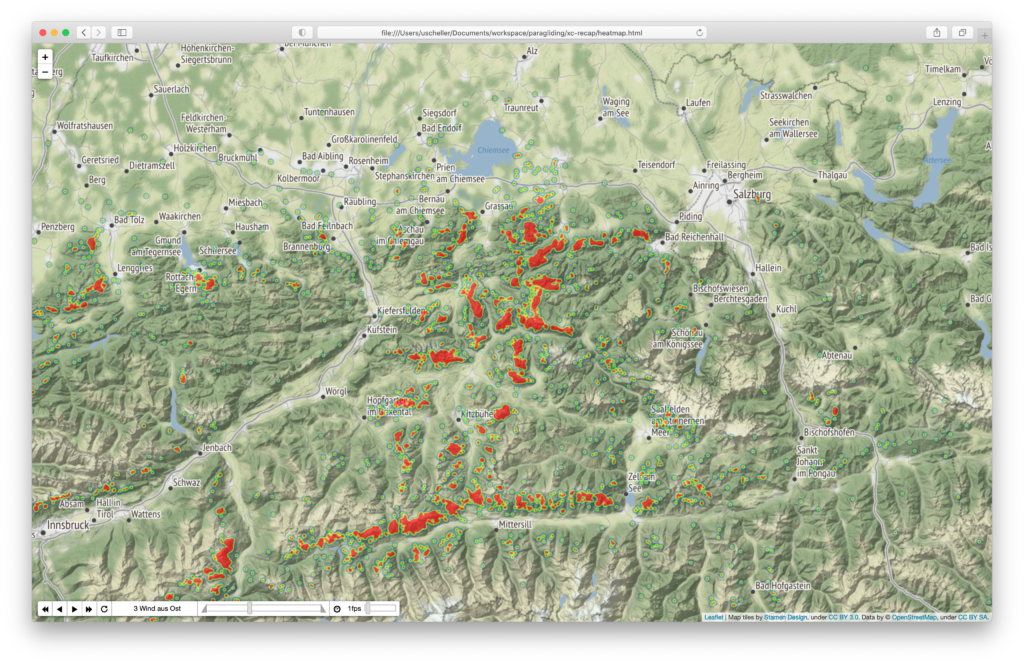
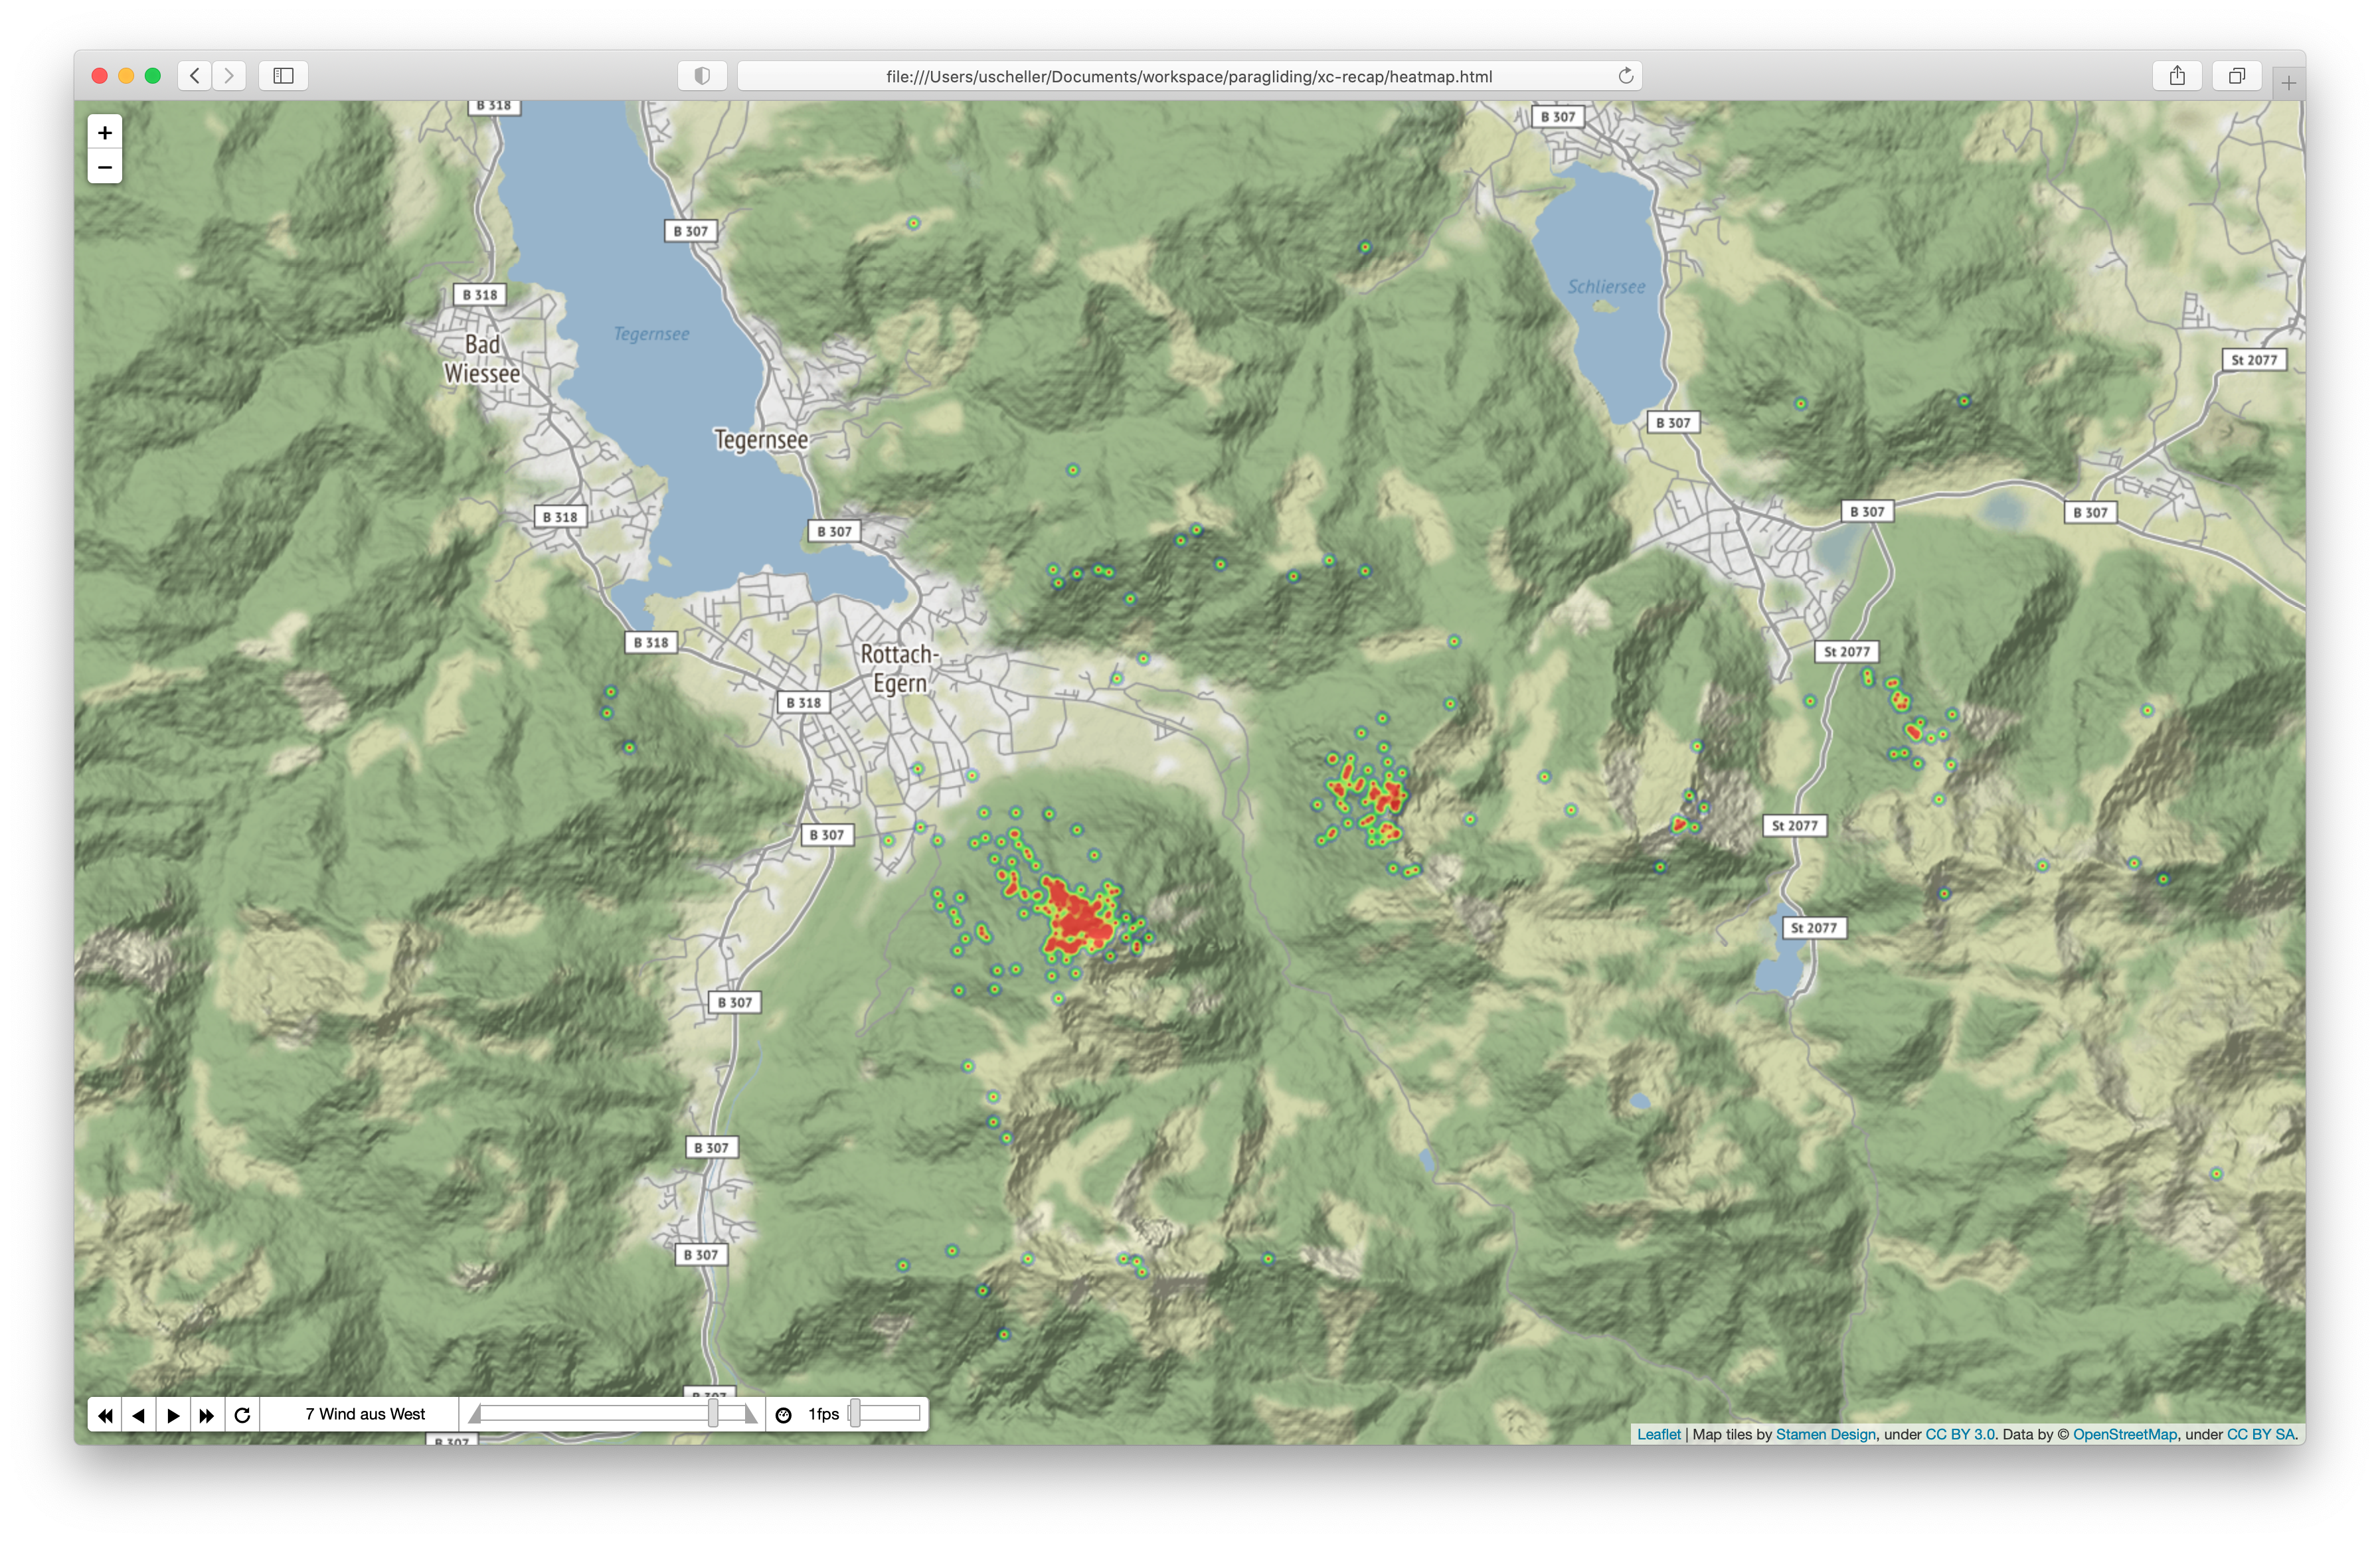
East
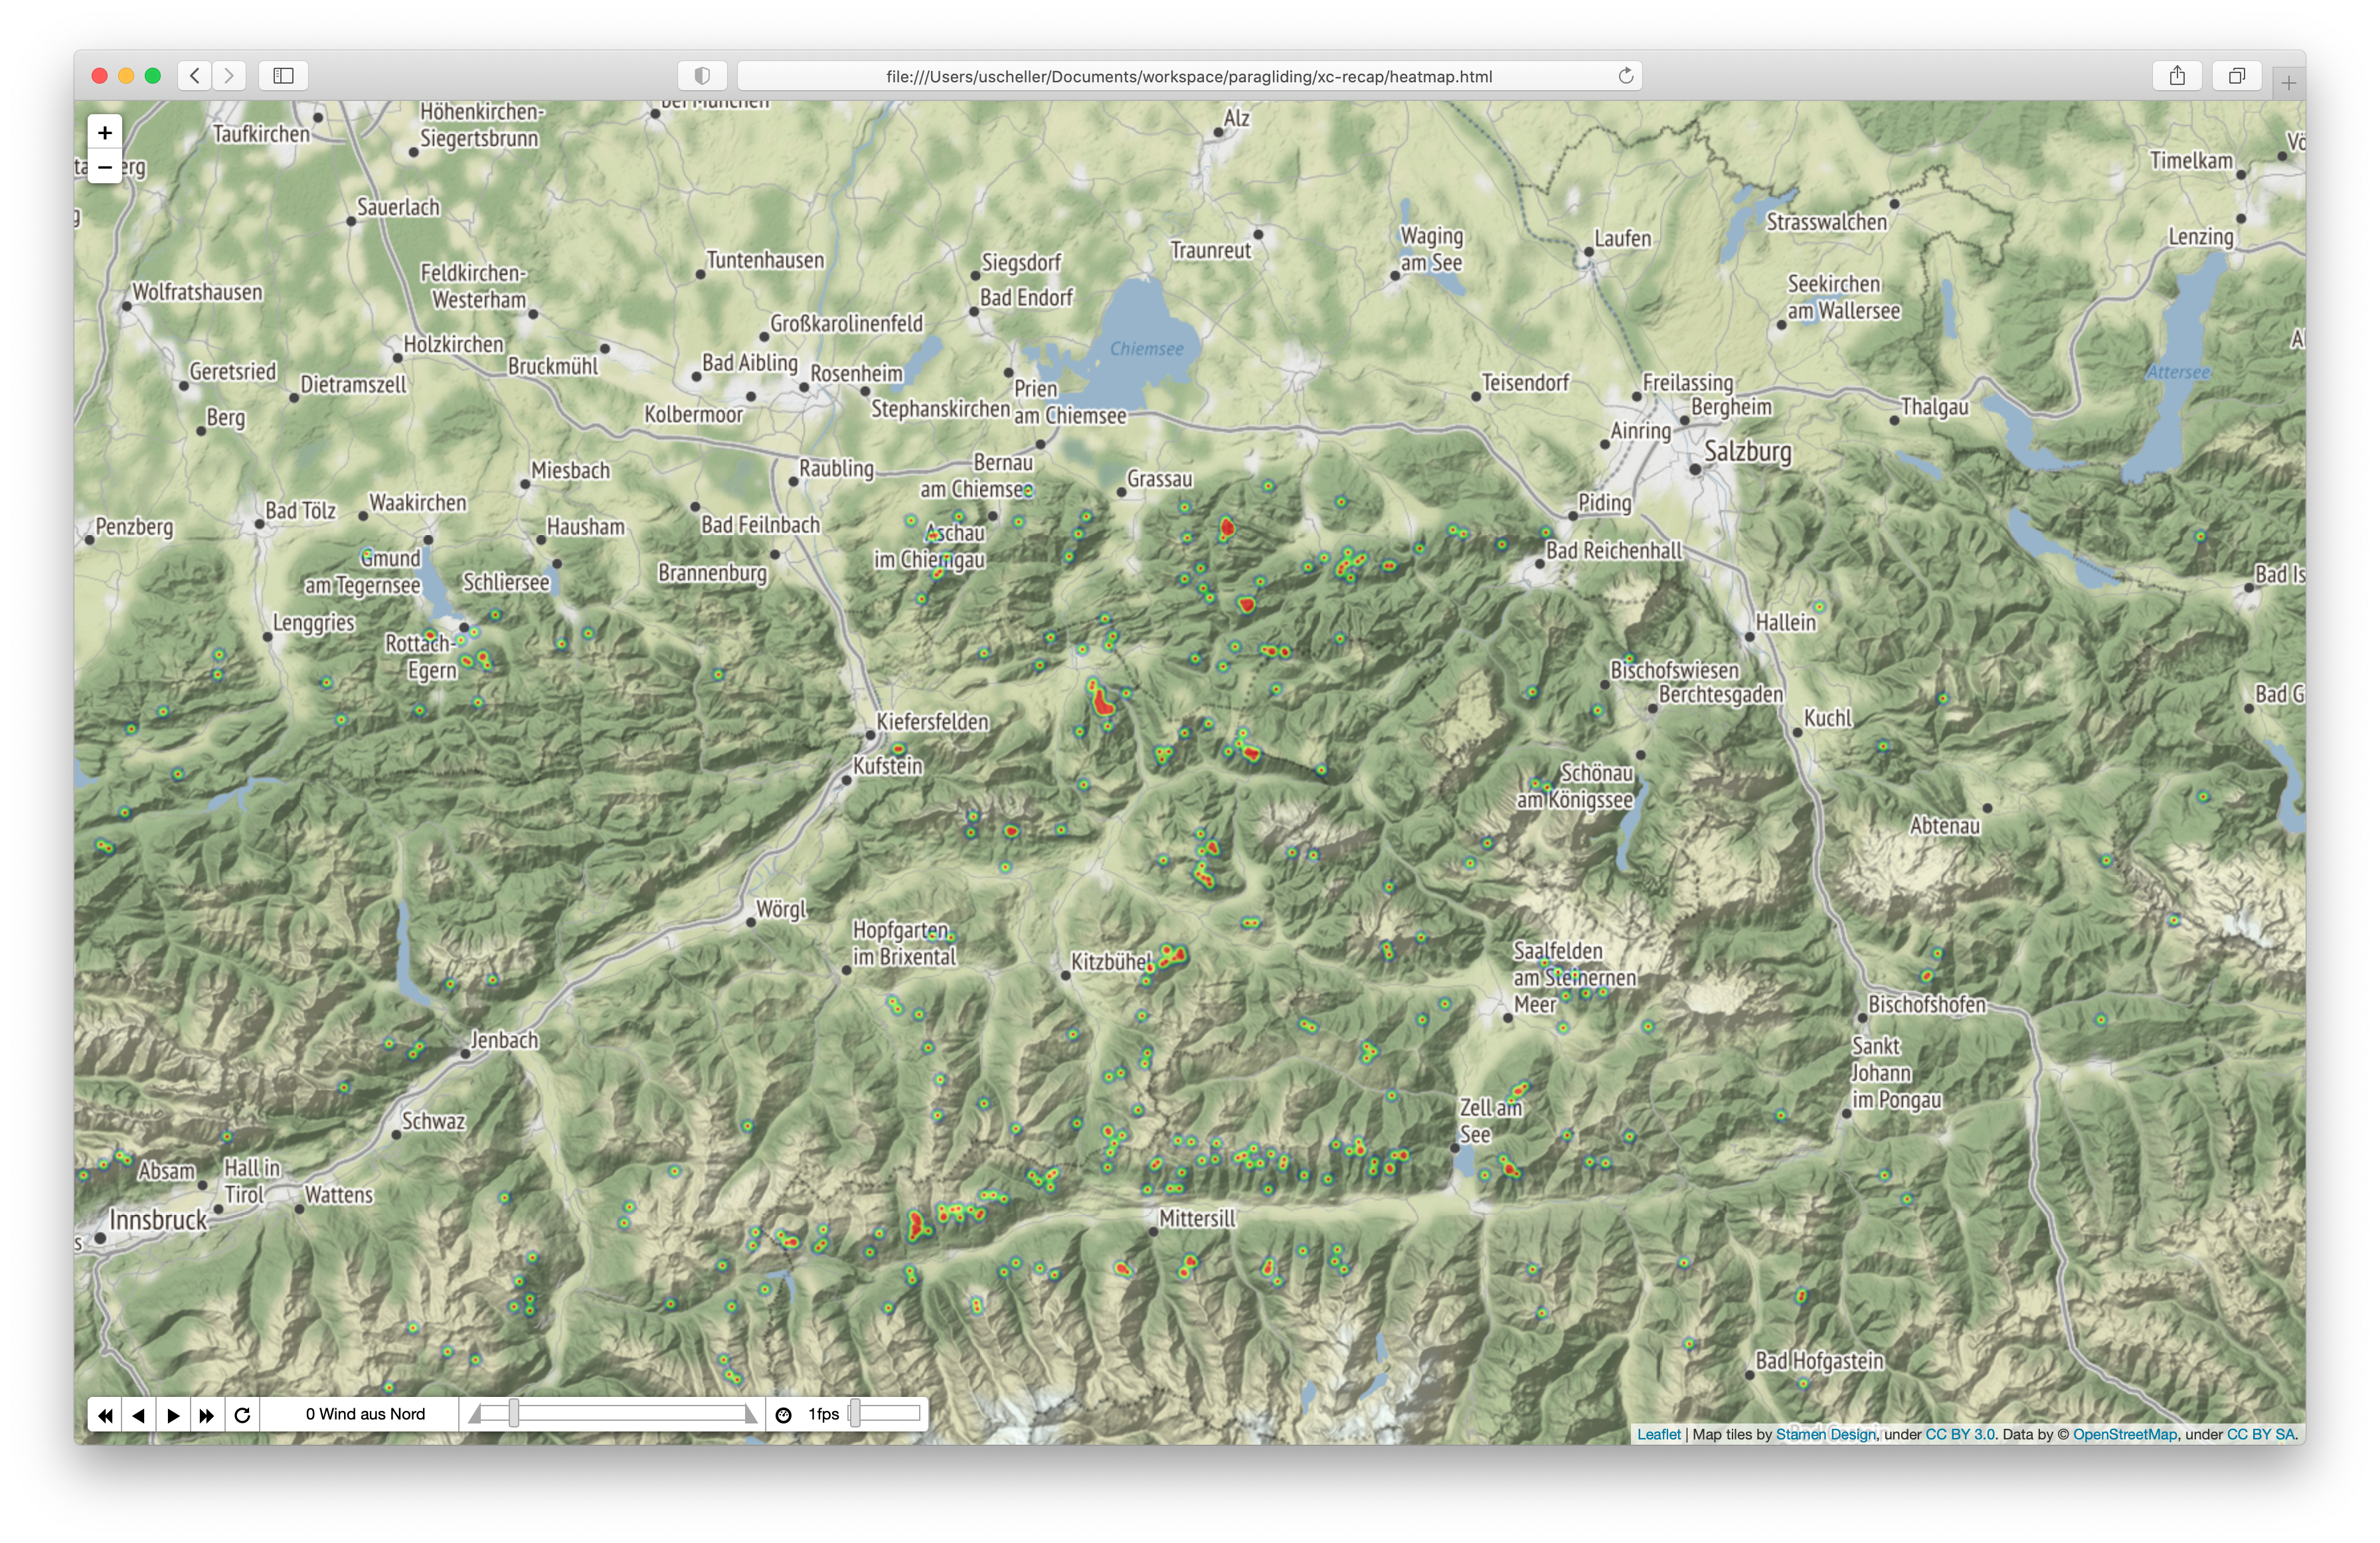
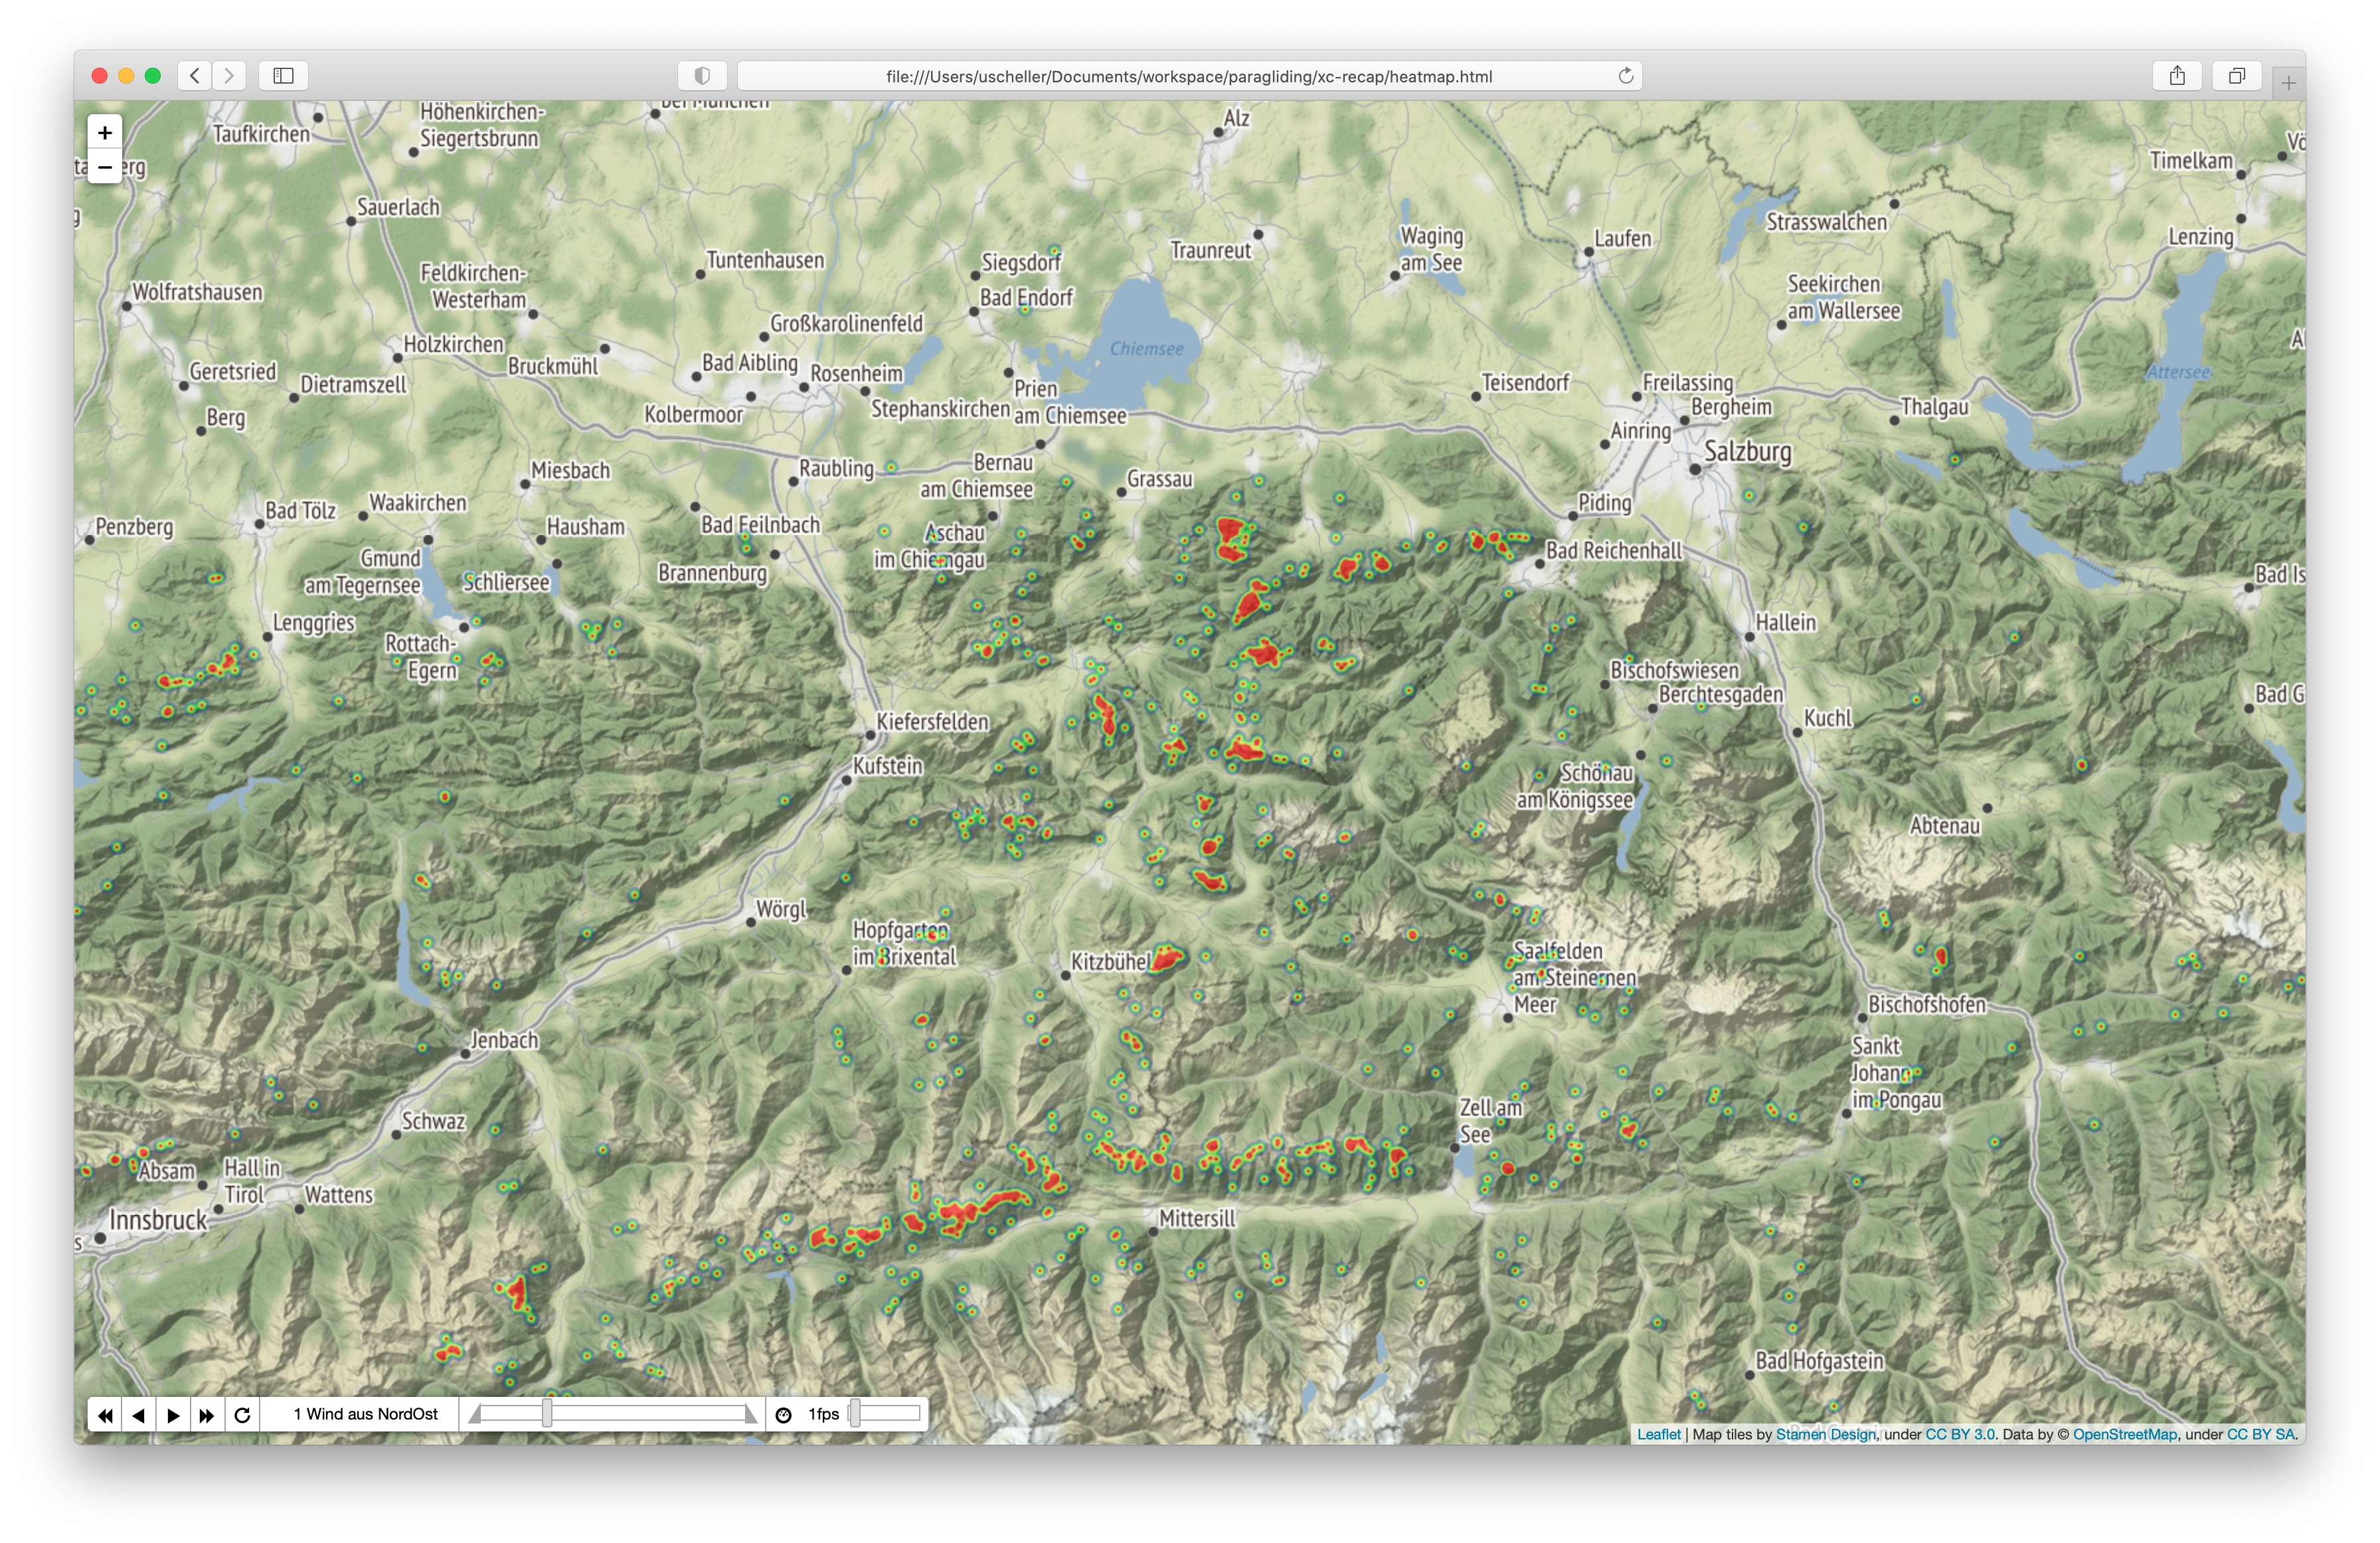
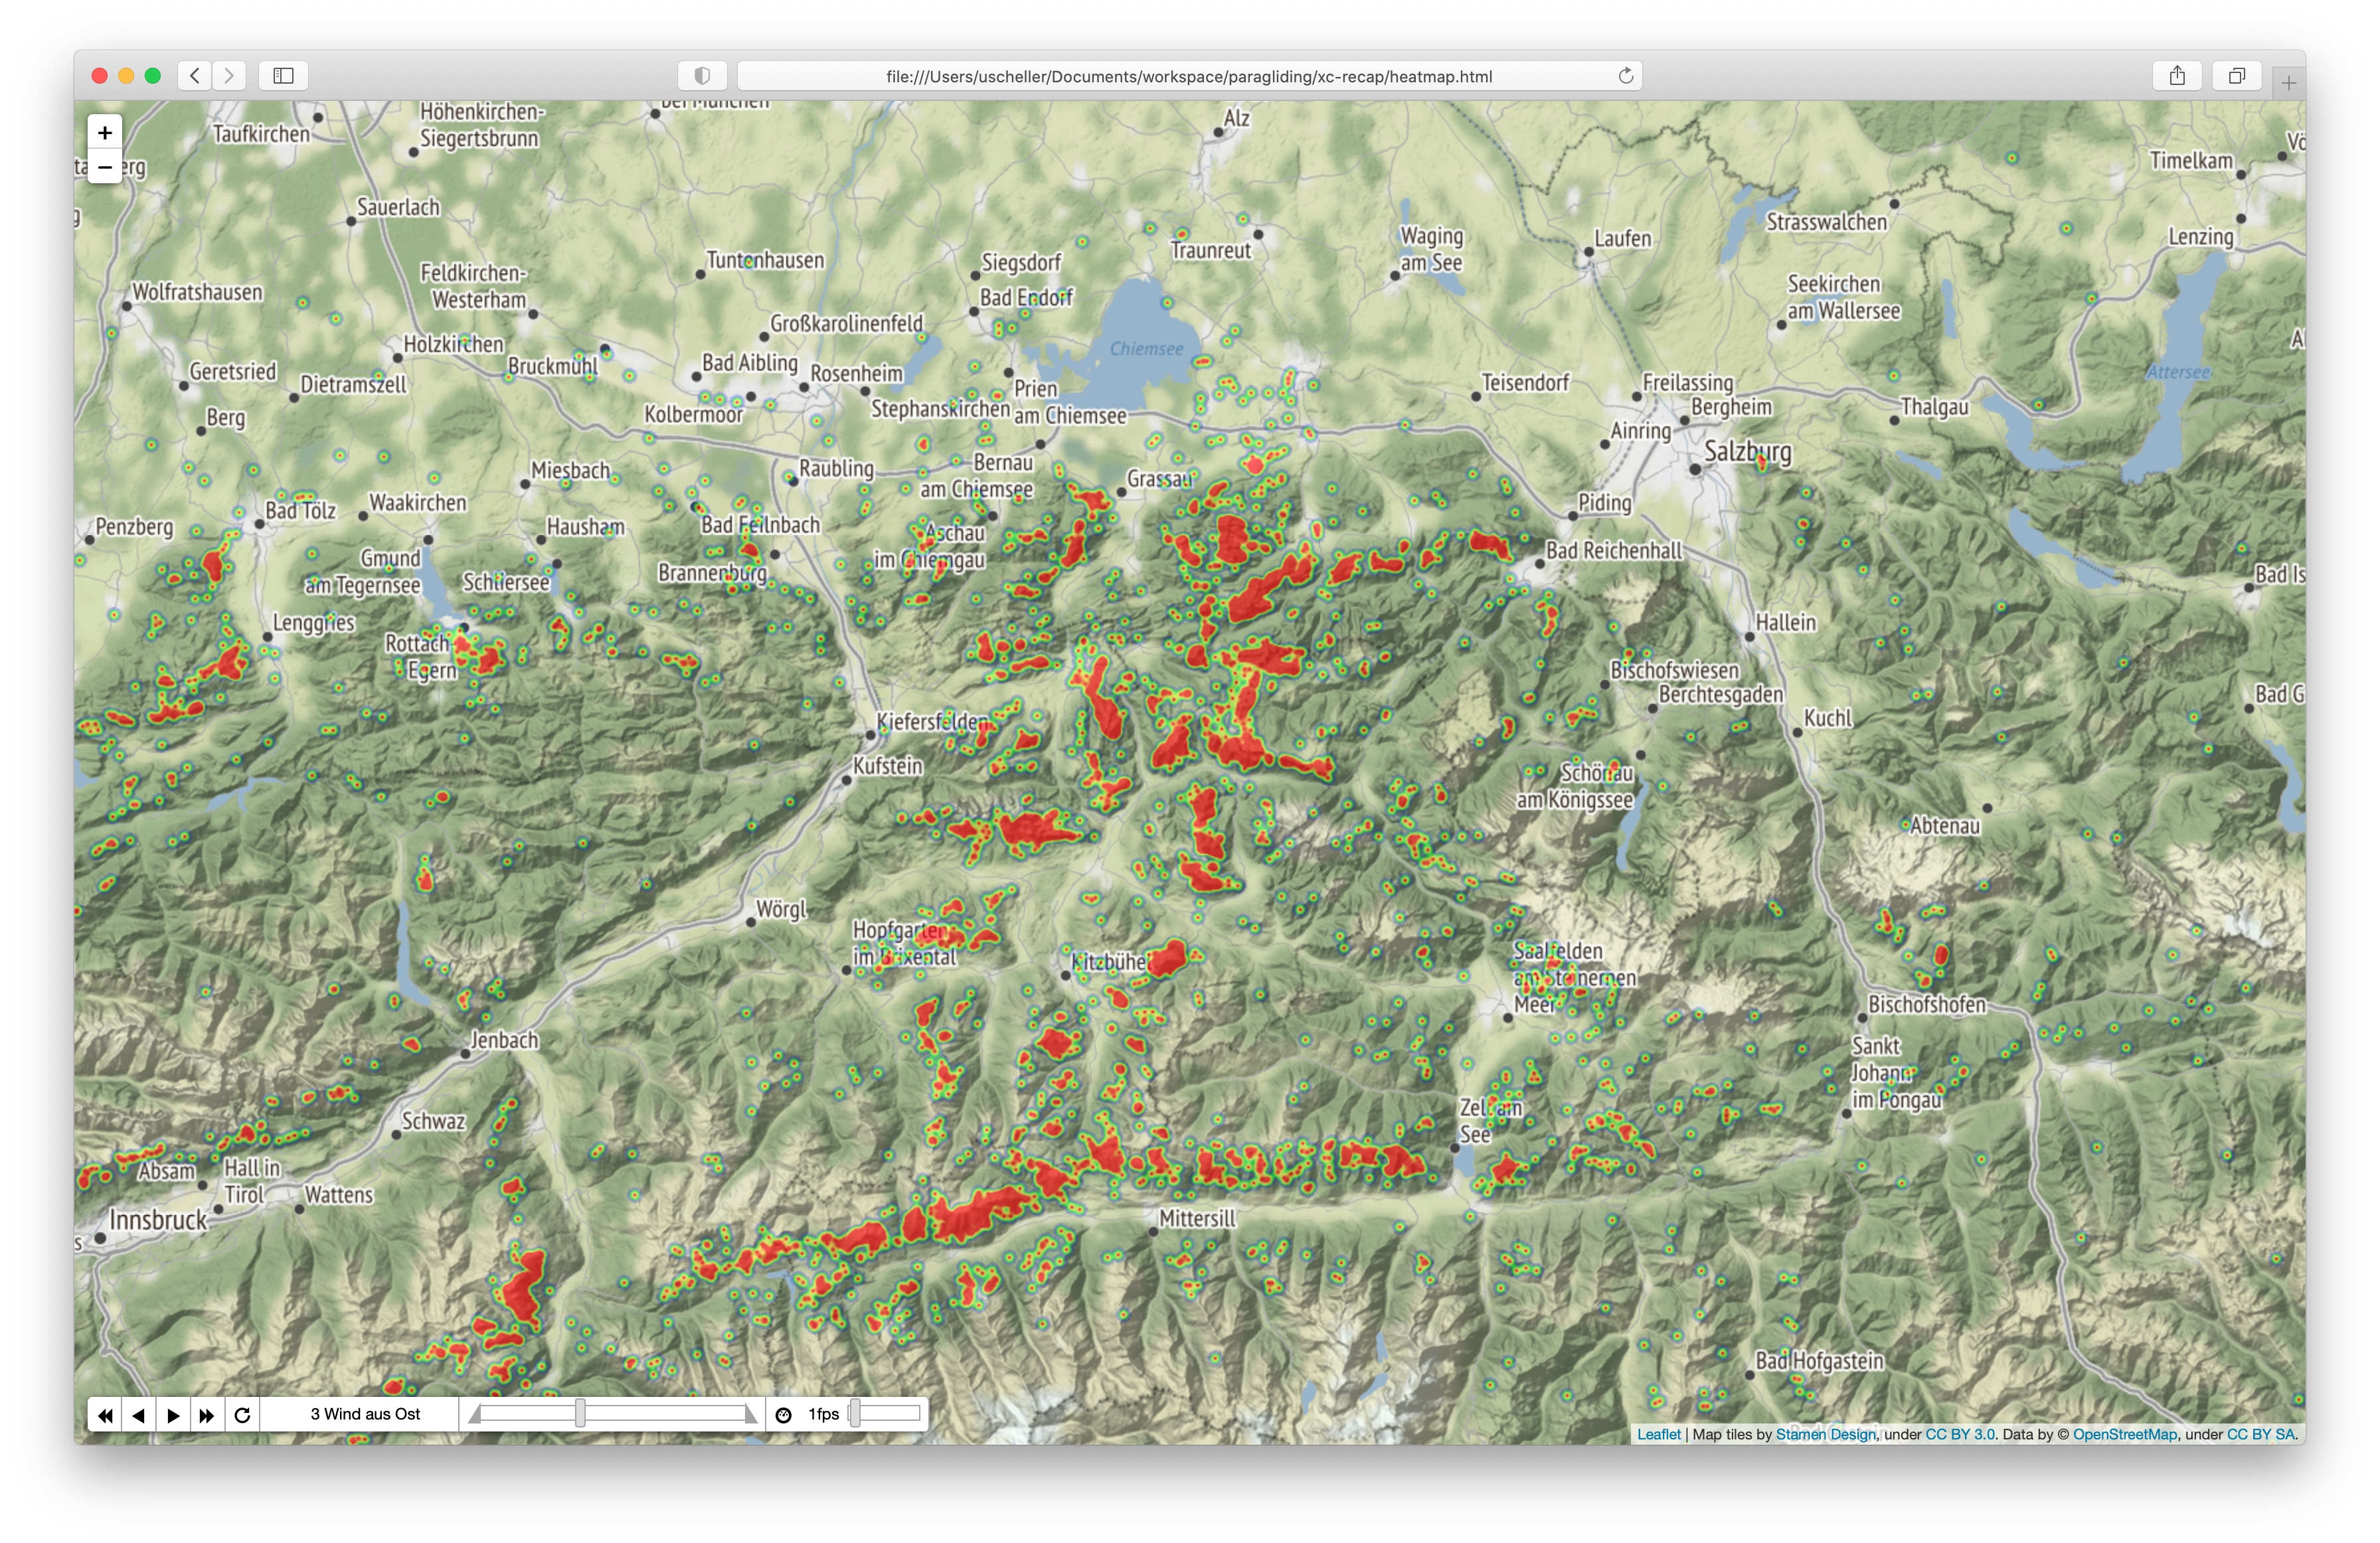
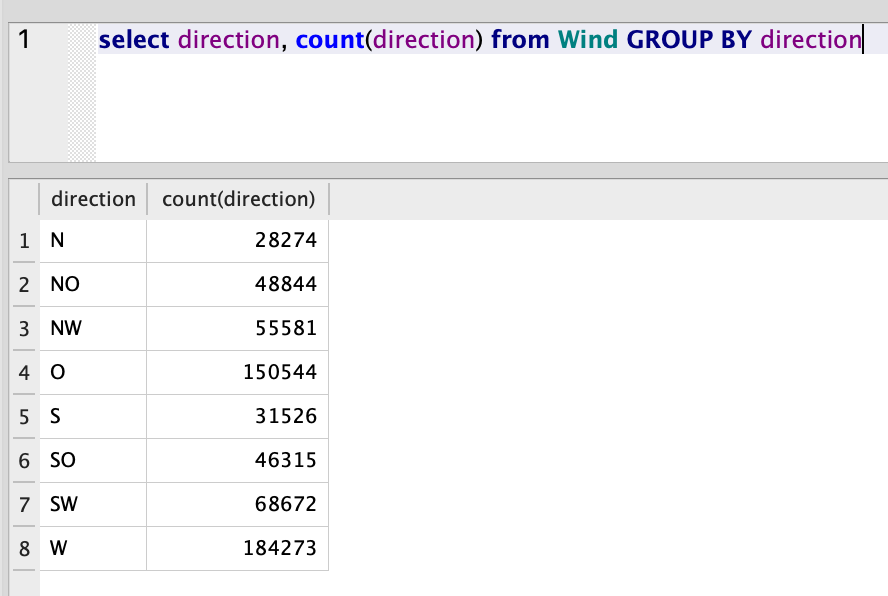
First of all, you can see a lot more red for the eastern wind than for north(-east). This could be either because the eastern wind is better or because this wind situation is more likely to happen. The heatmap does not reason about the data but the fact is that there are way more thermals appearing with an east- and a west-wind than all the other directions. The database shows how significant that is:
When moving closer to a certain area, we can see how frequently they are flown based on the wind. For example, the Wallberg is a well-known west wind mountain:


North- and south-wind show very little thermal action. Even the east-wind does not come close to what happens with west-wind. For Wallberg, this states the obvious for experienced local pilots. However, it might not be obvious for beginners. And it can be helpful to understand which cross country routes work with which wind direction. Does the Baumgartenschneid (across the valley to the north) work with north-wind?
Wrap up
We can now calculate windspeed from GPS fixes and use that data for filtering and grouping. The calculation is compute-intensive and we keep only one value regardless of the height.
Keep in mind that this data is based on wind calculations from the raw thermals. It is not necessarily the same as the overall wind of the day. And there is no statement about turbulence or difficulty. All we can see is that someone found a thermal lift that happened to be in the computed wind drift. We don’t know whether the drift was caused by a valley wind, some lee side rotor, or the overall weather.
Have a look at the Wind based thermal heatmap for yourself.
Related read: Calculating wind speed from the GPS track
Parameters used:
- Only thermals with a wind speed >= 5 km/h are shown
- Each thermal has a minimum altitude gain of at least 300 m
- Wind directions are grouped into [N, NO, O, SO, S, SW, W, NW]
- Data is based on ~600.000 thermals
- Public flight database of DHV, mostly from the german community
Technology used:
- Python with pipenv
- PyDev
- Folium, Numpy, Scipy
Related Posts
Make your website or web-app offline available
Android developers vs. web One great advantage of native apps over web apps is that they don't depend on an online connection to start. Therefore the startup is fast and you can use them in…
Building a very easy text classifier in python
Some of the developers at match2blue are creating a text-interest-matcher. Leaving buzzword bingo aside, that means the software calculates whether a text is interesting based on users' interests. So basically you, as a user, have…

How AI will change software development
I recently had some spare minutes while my wife was driving us to the family Christmas meetup. This time was great for a quick AI coding challenge to see what is possible within a few…